How To Draw Circuit Diagram
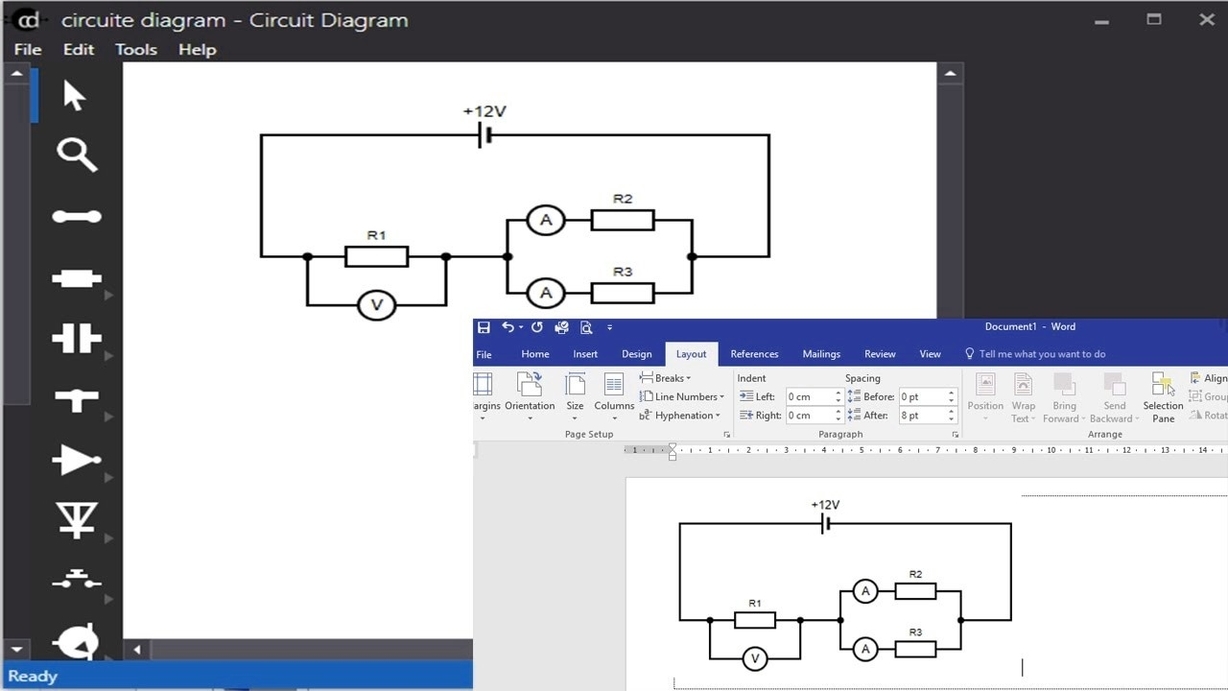
How To Draw Circuit Diagram: Drawing a circuit diagram involves using standardized symbols to represent electrical components and their connections, ensuring clarity and accuracy in depicting electrical circuits.