North Korea GDP per capita

This diagram presents North Korea GDP per capita. World Bank is the source of this economic data. Based on the latest economic info provided for North Korea.

Charts | Diagrams | Graphs
This diagram presents North Korea GDP per capita. World Bank is the source of this economic data. Based on the latest economic info provided for North Korea.
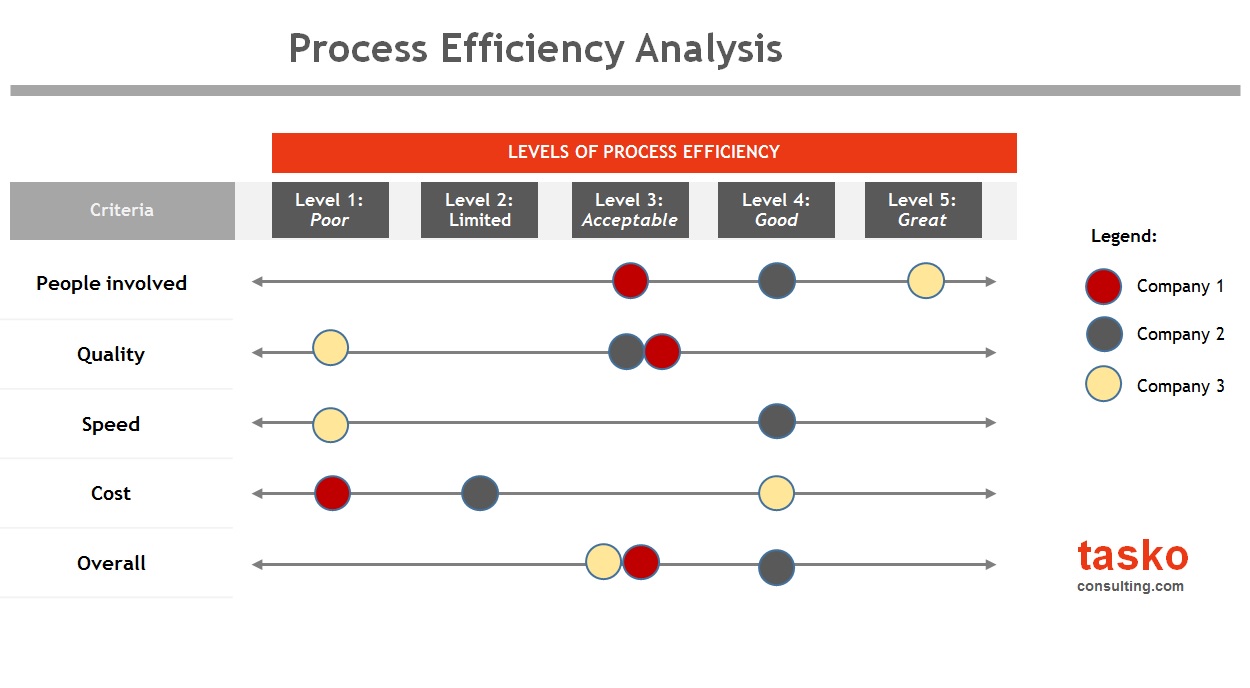
Process Efficiency Analysis: Process efficiency analysis identifies bottlenecks, redundancies, and delays in business workflows. By measuring inputs versus outputs, organizations can streamline operations, reduce costs, and improve service delivery.

Marketing Macro Environment: The marketing macro environment encompasses external factors that influence a companys marketing strategies and decisions. These factors include economic conditions, social and cultural trends, technological advancements, political and legal regulations, and environmental considerations. Understanding the macro environment helps businesses anticipate market changes, identify opportunities, and mitigate risks.
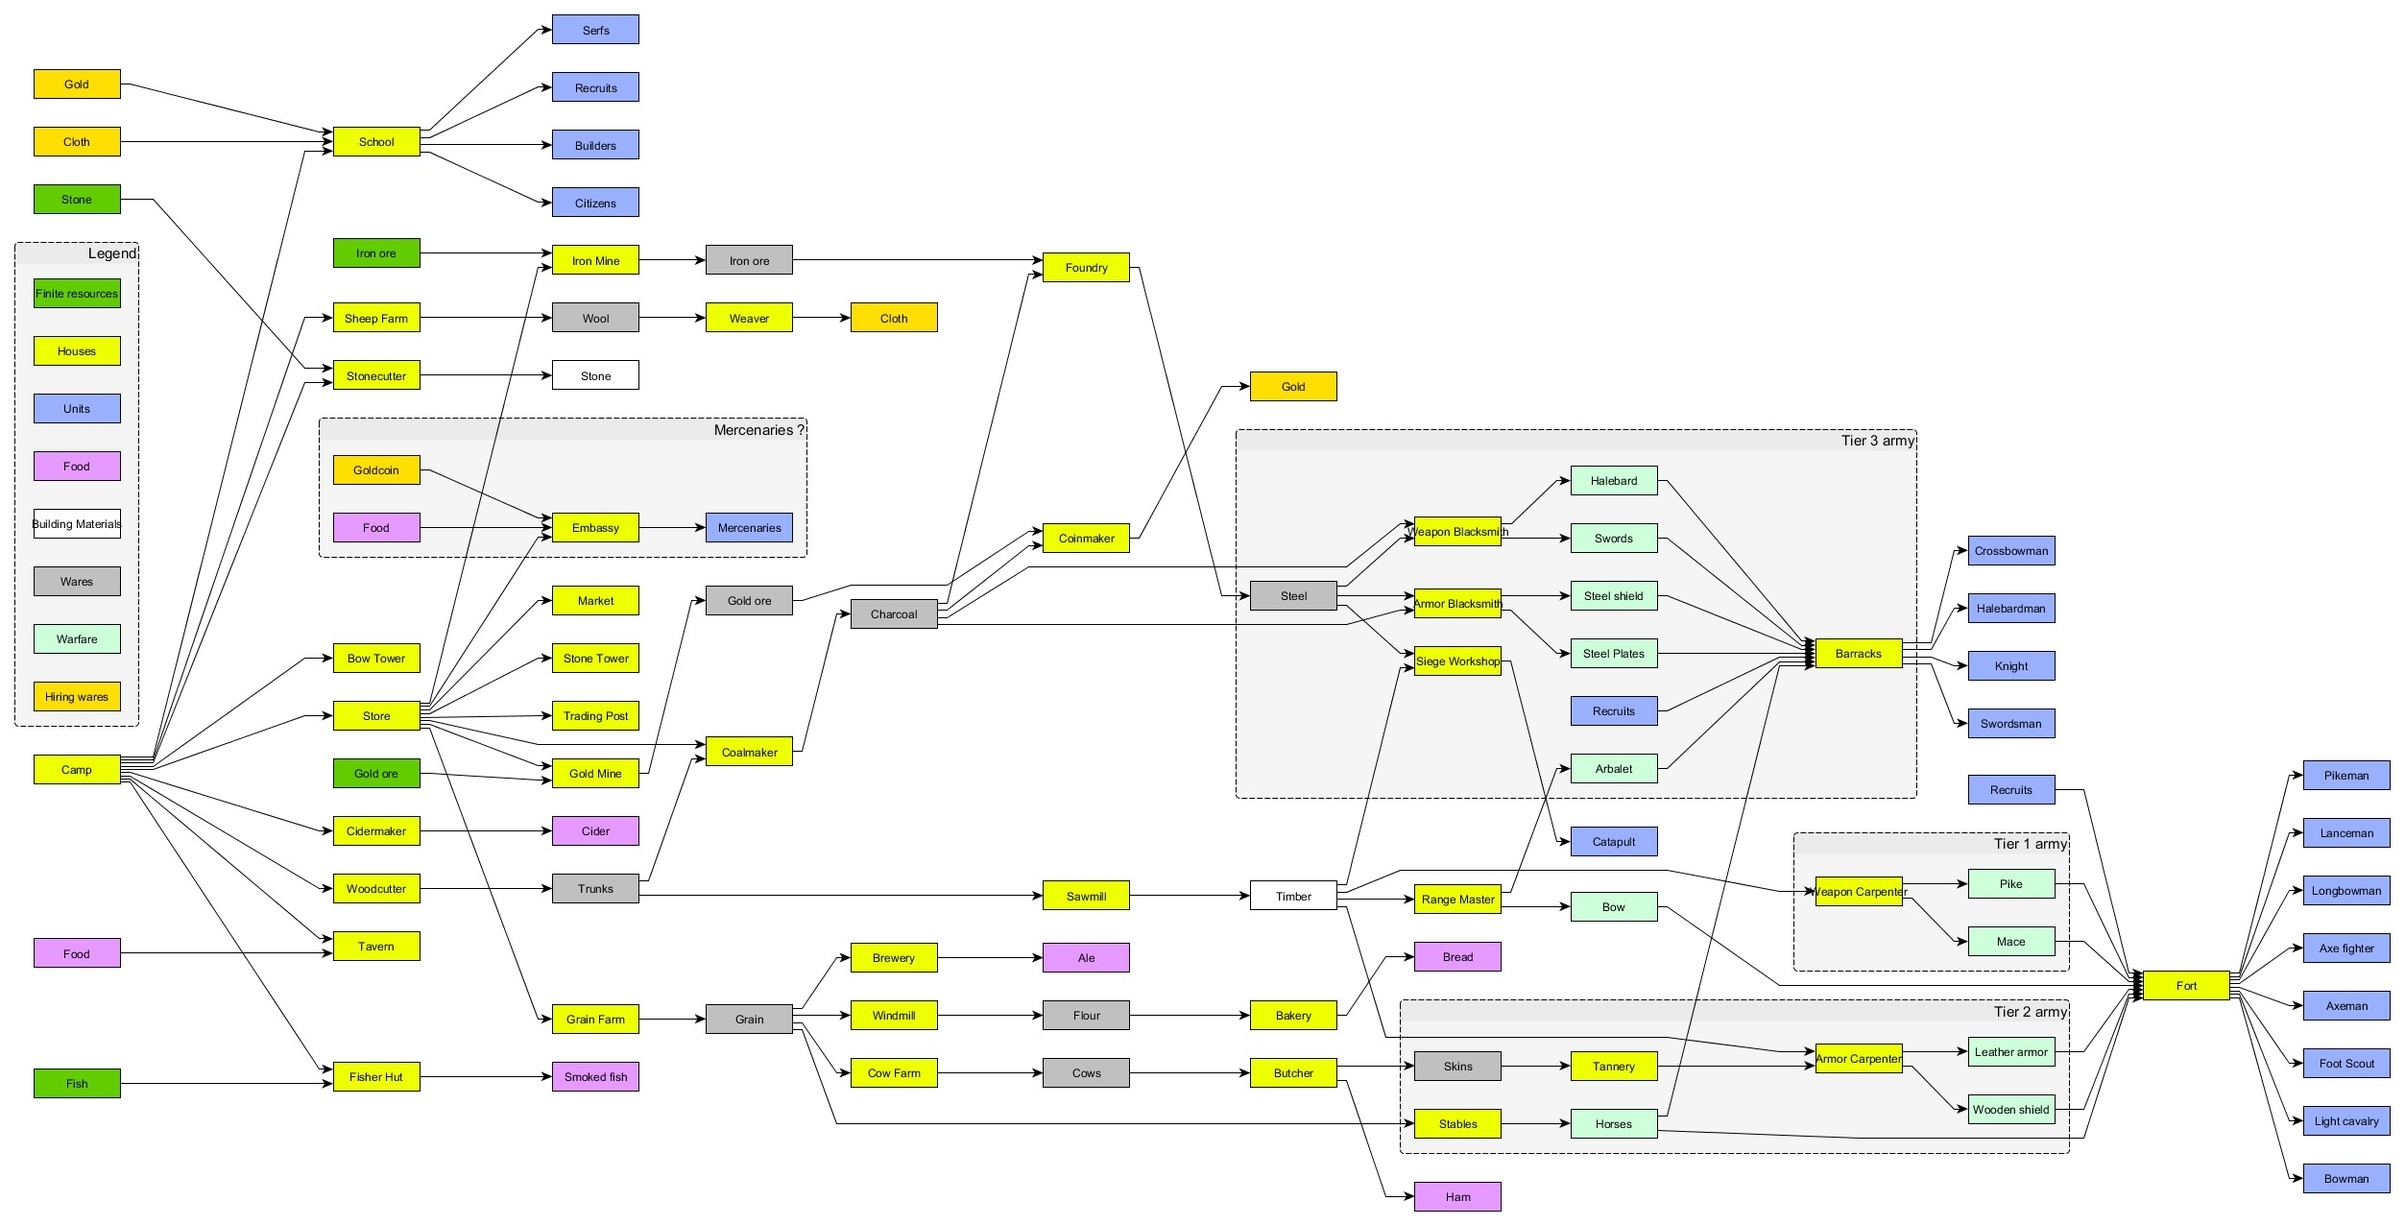
Tree Diagram Software: Tree diagram software is used to create hierarchical diagrams that represent decision trees, organizational structures, or process flows. It allows users to visually map out relationships and dependencies between different elements. This software is especially useful for decision-making, project planning, and process optimization, providing a clear structure to complex information.
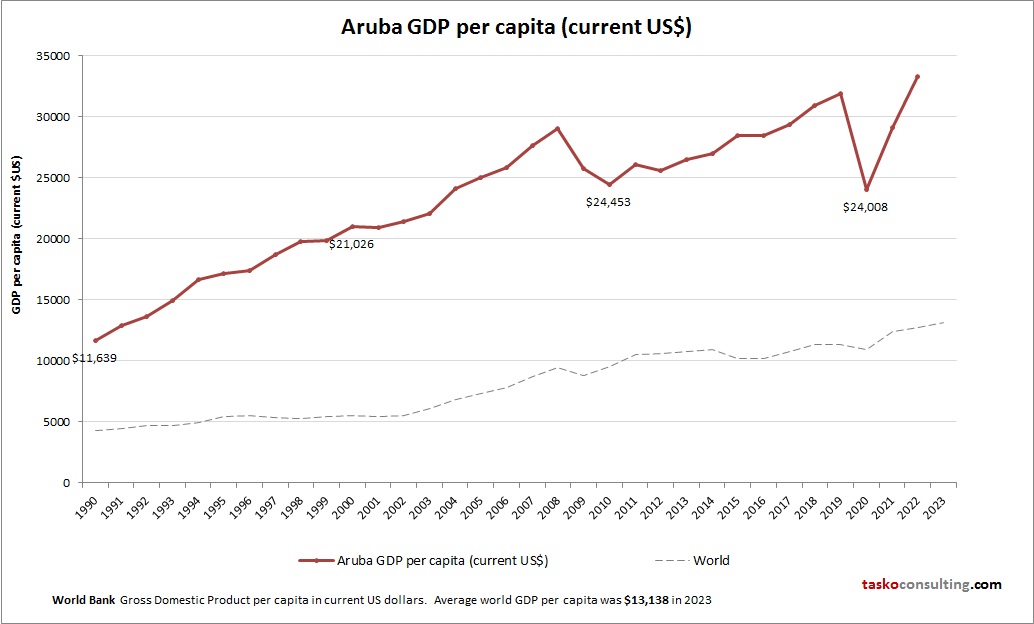
This diagram presents Aruba GDP per capita. This is according to World Bank GDP stats by country. Based on the latest available information for Aruba.

What’s the Difference Between Agile and DevOps: Agile and DevOps are both methodologies focused on improving software development processes, but they have different focuses. Agile emphasizes iterative development, flexibility, and customer collaboration, while DevOps is centered on streamlining the deployment pipeline by integrating development and operations teams. Together, Agile and DevOps can lead to faster delivery and better alignment between development and IT operations.
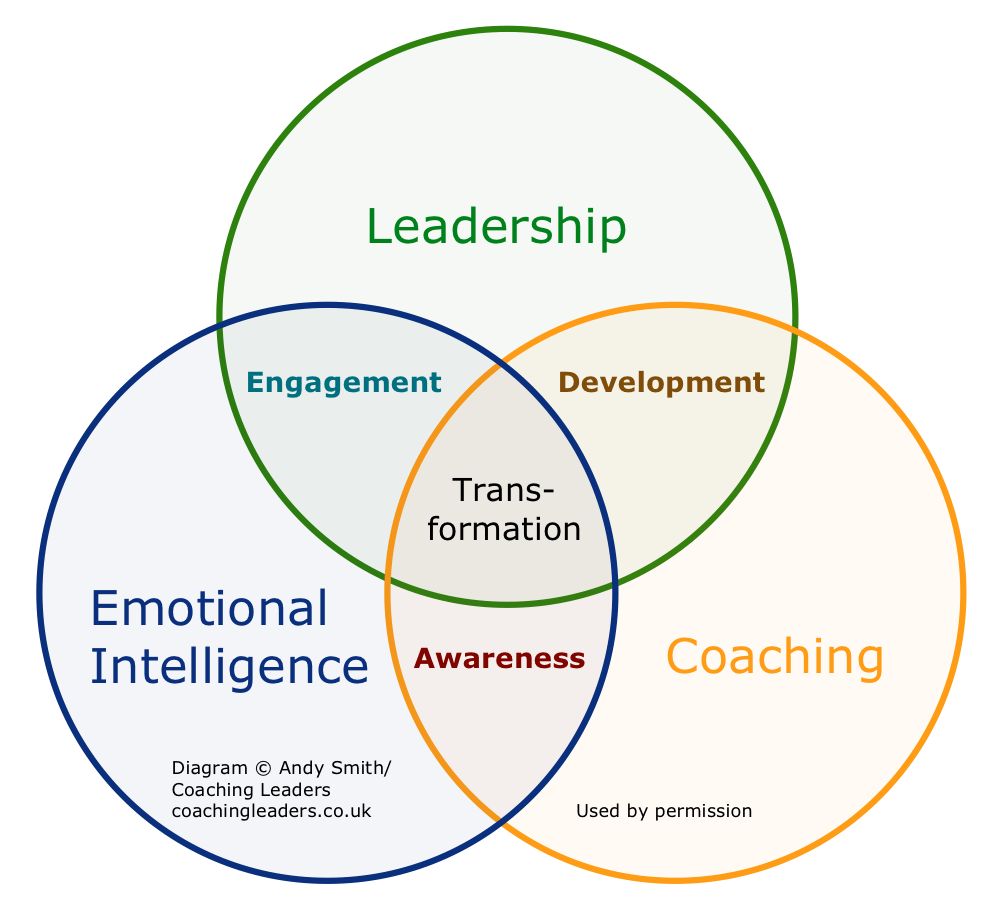
How leadership emotional intelligence: Leadership emotional intelligence refers to a leader’s ability to recognize, understand, and manage their own emotions as well as the emotions of others. Emotional intelligence in leadership helps to foster better communication, empathy, and decision-making, contributing to a more positive and productive work environment. Leaders with high emotional intelligence can motivate their teams, resolve conflicts, and adapt to changing circumstances more effectively.

Camera Lens Diagram: A camera lens diagram illustrates the optical components within a lens, such as glass elements and their arrangement, highlighting how light passes through to focus an image onto the sensor or film.

Operating Model: An operating model defines how a business organizes its resources, processes, and systems to deliver value to customers. It outlines the structure, roles, and responsibilities within the organization, ensuring efficient and effective operations.

Diagram of Leadership Skills: A Diagram of Leadership Skills visually represents the key competencies and qualities needed for effective leadership. It often includes attributes like communication, decision-making, vision, empathy, and problem-solving. This diagram helps individuals and organizations assess leadership capabilities and create development plans to nurture future leaders.