Stress Management Tips
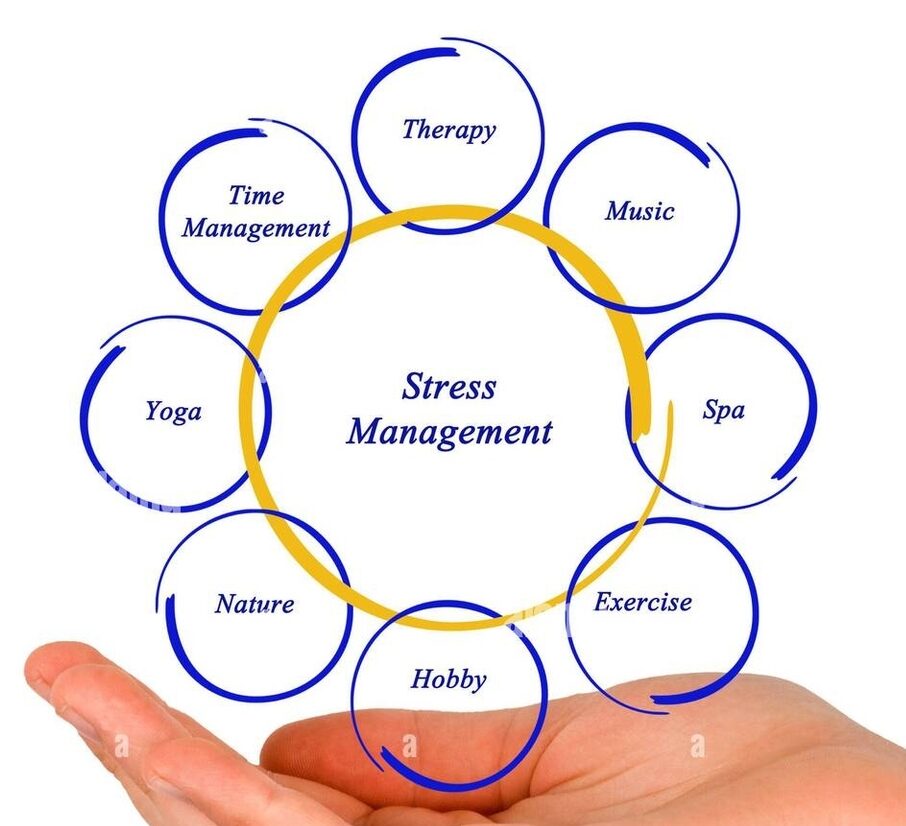
Let’s face it—life gets stressful. Whether it’s work deadlines, family responsibilities, or just trying to stay afloat in a busy world, stress shows up in all kinds of ways. And while we can’t make stress disappear completely, we can learn how to manage it better. This isn’t about perfection or adding more pressure. It’s about finding small, realistic ways to feel a little more calm and in control—starting today. What Continue reading Stress Management Tips