
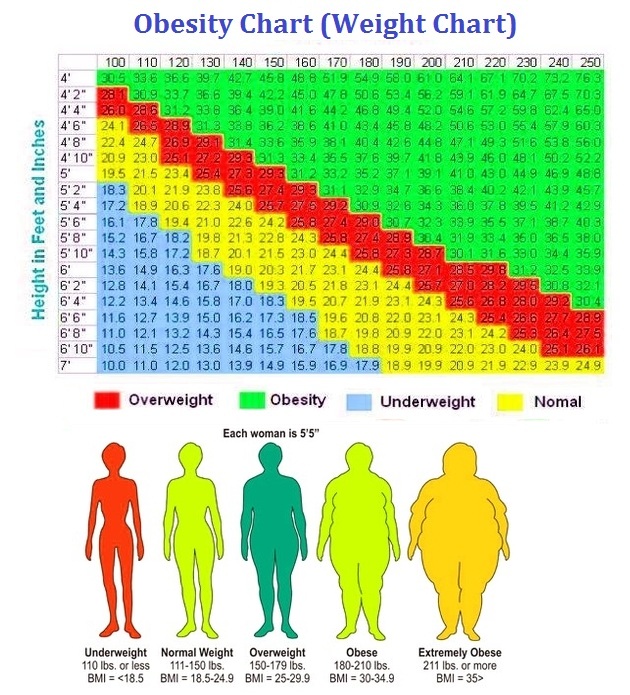

Obesity Diagram – Obesity Chart – Obesity charts show the level of obesity for women and men. This type of graphic is often referred to as weight height chart. So what weight is considered obese? What is obesity in general? Am I obese or am I overweight and what is the difference? These questions can be answered by analyzing the below diagram, which provides an objective measurement and serves as good guidance in terms of whether one has excessive weight and fat.
Height is an important component as it is expected that tall individuals will have more weight. Bone density may be another factor and one’s appearance may not fully correspond to the obesity indicator. Obesity weight for a given height is presented in the below table. The below chart displays overweight, obese, normal and underweight weight by person’s height as well as a corresponding Body Mass Index (BMI).