
 Preschool sizing chart
  Situational Leadership Model
  Wellness
  Definition Of Agricultural System
  Parts Of A Bird Diagram
  Strategic Partnership Framework
  People Process Technology
  Tornado Diagram
 - Cell Diagram
 Types of Skin Cancer
  Current state vs. future state
  Wind Power Diagram
 - Plot Diagram
 Strategic Marketing Framework
  Hub And Spoke Model
  Brain Structure And Function
  Largest cities in the world
  Essay Structure
  Work Breakdown Structure Template
  7FE Framework In Business Process Management
Category Archives: Top
BMI in Pounds
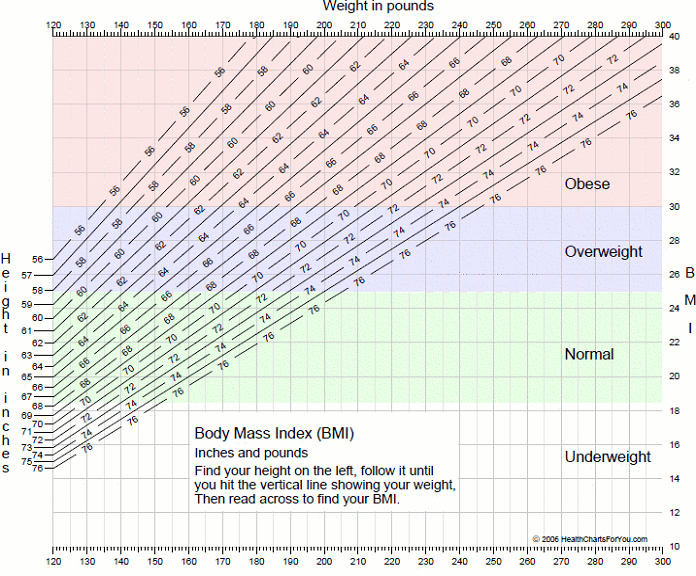
Body mass index (BMI) is a measure of body fat based on height and weight that applies to adult men and women. Enter your weight and height using standard … This chart is suitable for normal to very overweight (obese) people whose BMI value falls within the range: 19 – 35. If you are very overweight and your weight is not listed try our other chart. Select the closest weight Continue reading BMI in Pounds
Weight Loss
Weight Loss is an intentional or unintentional reduction of the body mass, mostly due to a loss of body fat, fluid, muscle. Intentional weight loss requires a conscious effort to improve an actual or perceived overweight body by dieting and/or undertaking physical activity. Dieting without proper nutrition and detoxing may result in rebound to the original weight. Proper dieting and nutrition, lifestyle changes and physical activity all help weight loss Continue reading Weight Loss
Best Diagrams and Charts
Below are the most popular charts and diagrams as rated by our users: Human Body – Diagram of human body showing parts of the body and their purpose Smiley Faces – Chart showing various types of smiley faces symbols Digestive System Diagram – Diagram that depicts various parts of the digestive system Human Cell – Diagram showing human cell parts Heart Diagram – Diagram of a heart with different parts Continue reading Best Diagrams and Charts
Human Organs – Body Organs Systems
Human Organs – Human Organs Diagram – Body Organs – Human organs systems – Human body systems – Diagram showing various human anatomy and body systems including skeletal system, muscular system, nervous system, digestive system, respiratory system, circulatory system, etc. Human organ systems diagram. Source: Cloudfront
Car Diagram
The Car Diagram below shows various parts of a car including the following components: engine, tires, brakes, lights, air bags, wheels, various systems (ignition, cooling and charging), transmission and others. The heart of any vehicle is an engine At its core are the cylinders with pistons moving up and down. The cylinders can be arranged inline, in a V shape (arranged at an angle against each other) or horizontally. There Continue reading Car Diagram
Plant Cell Diagram
Plant Cell is a basic block of the plant structure. The plant cell diagram below displays various parts of the cell including nucleus, cytoskeleton, cell wall, membrane, centrosome, central vacuole, chloroplast and others. Lets explain what each component is responsible for: The nucleus is the commanding center of the cell controlling various functions of the cell and containing DNA. The nucleus is covered by the nuclear membrane. This is different Continue reading Plant Cell Diagram
Bike Frame Size and Seat Height Chart
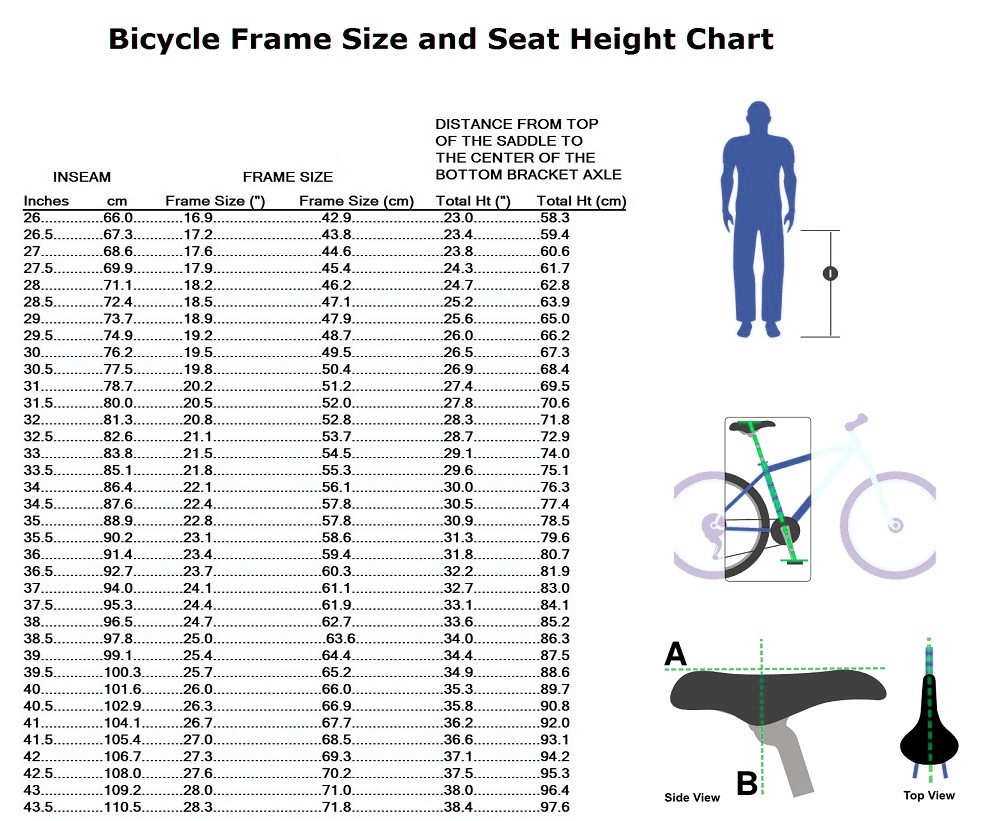
Bike frame size and seat height chart below shows the dimensions of the frame size and seat height based on the inseam height. To choose the right bicycle and adjust the height of the saddle, first measure inseam height and then multiply the value by 1.08, which will give you the seat height (see the table below). This measurement can be used for both mountain and road bikes. Getting the Continue reading Bike Frame Size and Seat Height Chart
Human Body – Human Anatomy
Human Body – Human Anatomy – Human Body Diagram – Human Anatomy Diagram – Anatomy of a human body is shown in a diagram below depicting the key body organs and parts; this diagram is great for kids education. Human Body chart. Human Anatomy chart. Source: Science Kids
Multiplication Chart – Multiplication Table
Multiplication Chart – Multiplication Table. Multiplication chart showing a table of numbers multiplied. Multiplication chart 12 x 12. 12 by 12 multiplication chart colored. Multiply Color Multiplication table. Multiply Chart. Multiplication. Multiplication table for kids 100, 144, 10×10, 12×12. Printable. Kids multiplication chart. Big large multiplication table. Division chart.