Bio Directorate Org Chart
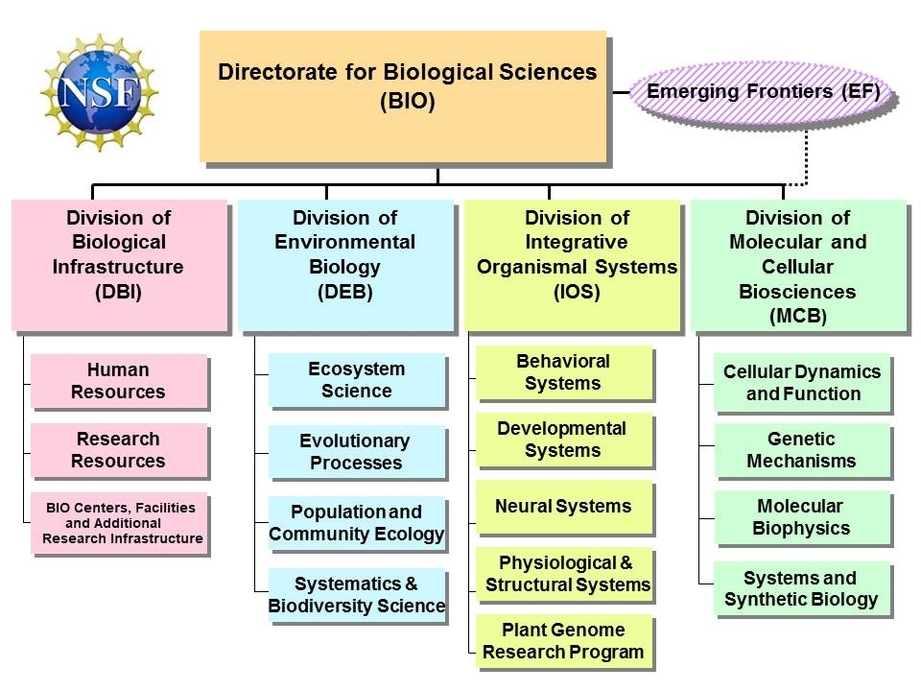
Bio Directorate Org Chart: A Bio Directorate org chart outlines the organizational structure of a biological research department, showing the hierarchy and relationships between different teams and roles.