DSM Governance Framework
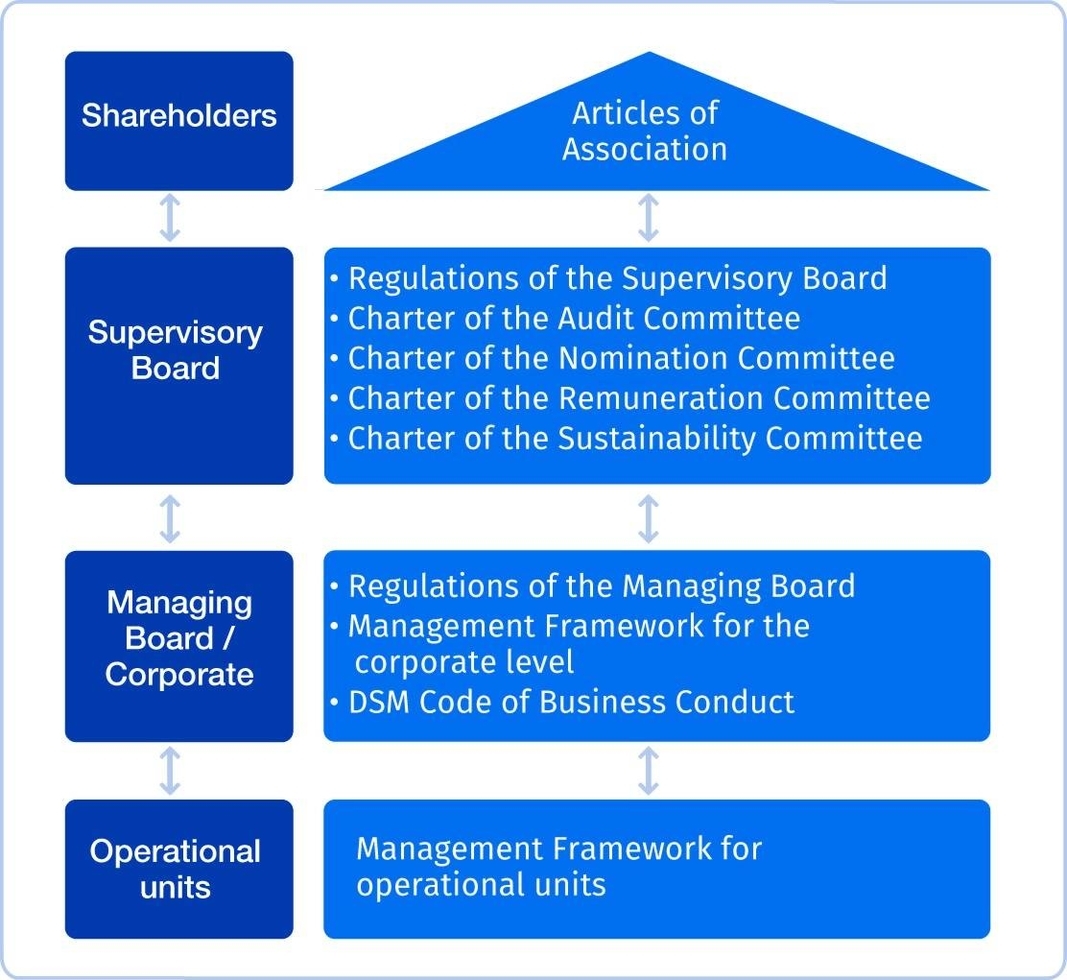

DSM Governance Framework: The DSM Governance Framework outlines the companys overall governance structure, including the roles and responsibilities of the Managing Board, Executive Committee, and various corporate functions. It ensures compliance with the DSM Code of Business Conduct, corporate policies, and risk management practices. The framework also includes independent audits and committees to oversee financial reporting, fraud prevention, and disclosure of share-price-sensitive information.