
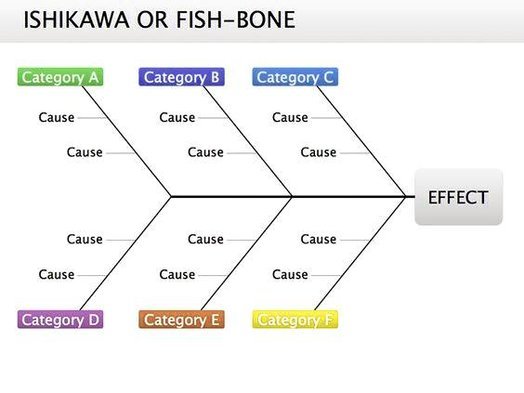

Ishikawa Diagram: Also known as a fishbone or cause-and-effect diagram, the Ishikawa Diagram helps teams identify root causes of problems. It categorizes potential sourceslike people, process, equipment, or environmentmaking it a powerful tool in quality improvement and troubleshooting.
Tags: cause and effect diagram, fishbone diagram, Ishikawa model, quality control tool, root cause analysis