
Skip to content
cropped cropped chart diagram1 2.png

Charts | Diagrams | Graphs

Charts | Diagrams | Graphs

Menu

Primary menu

  • Top
  • General
    • Upload Diagram
    • Sign
  • Business
  • Economy
  • Sizes
  • Anatomy
  • Health
    • Workout
    • Food
    • Stress
    • Cancer
  • IT
  • Science
    • Energy
  • Women & Men
    • Clothes
    • Military
    • Tools

Tag Archives: workflow analysis chart

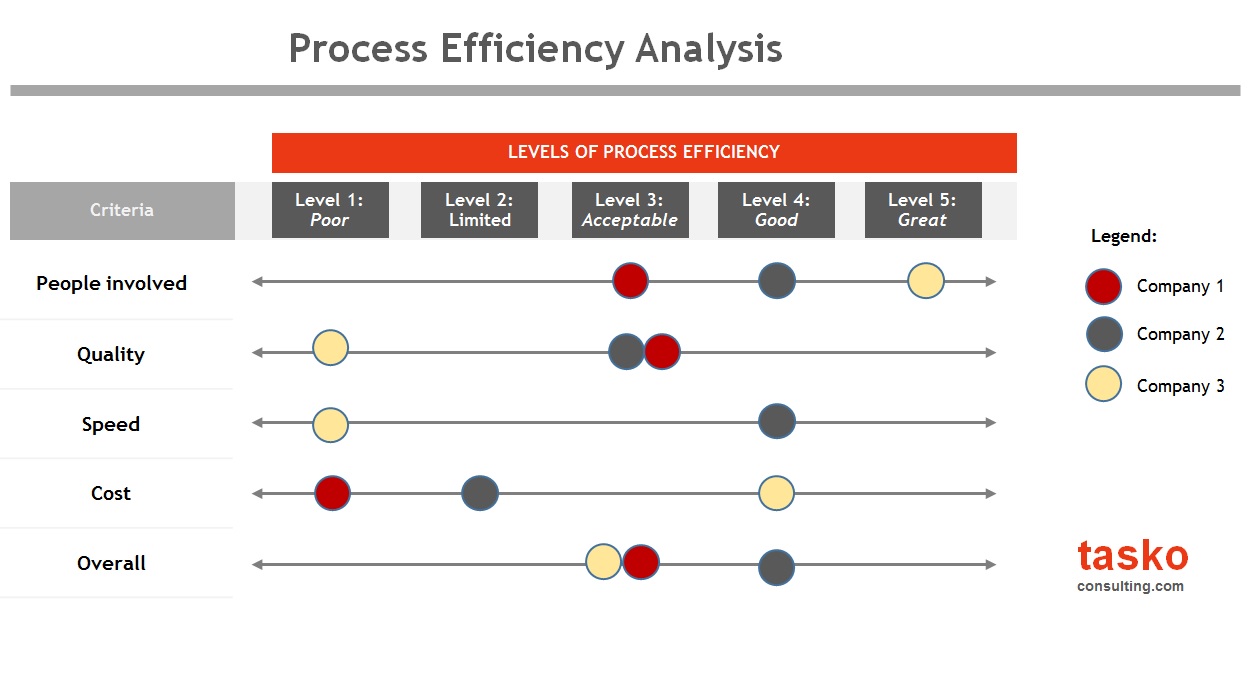
Process Efficiency Analysis
Posted on June 16, 2026 by chartdiagram
Process efficiency analysis

Process Efficiency Analysis: Process efficiency analysis identifies bottlenecks, redundancies, and delays in business workflows. By measuring inputs versus outputs, organizations can streamline operations, reduce costs, and improve service delivery.

Posted in Business | Tagged business process efficiency, efficiency optimization model, process improvement diagram, process optimization visual, workflow analysis chart

Primary Sidebar Widget Area

Top Diagrams

  • cardiovascular system Cardiovascular System
  • respiratory system diagram Respiratory System Diagram
  • Women ski size chart Women ski size chart
  • Cloud based architecture diagram Cloud Based Architecture Diagram
  • Splicing Rna Processing Splicing Rna Processing
  • obesity chart Obesity Chart
  • Agile model of software development the development cycle Agile Model of Software Development the Development Cycle
  • Brain Structure Representation Brain Structure Representation
  • Cell Division Stage Cell Division Stage
  • Stress Effect on Physical Health Stress Effect on Physical Health
  • Communication Plan Communication Plan
  • Project phases sequential powerpoint Project Phases Sequential PowerPoint
  • Largest cities in the world Largest cities in the world
  • Powertools Diagram Powertools Diagram
  • Inventory Management Diagram Inventory Management Diagram
  • Pounds to Kilograms – Kilograms to Pounds Chart
  • Cabo Verde GDP per capita Cabo Verde GDP per capita
  • battery diagram Battery Diagram
  • Graph Of The Global Economy By Gdp Graph Of The Global Economy By Gdp
  • Poland GDP per capita Poland GDP per capita

Latest Posts

  • Sales Diagram Described In Detail
  • Inventory Management Diagram
  • What Makes an Effective Leader
  • North America GDP per capita
  • Moldova GDP per capita
  • Cloud Computing Architecture
  • An Implementation Of A Strategy
  • Investment Pyramid Managing Risk
  • Ireland GDP per capita
  • Australia GDP per capita
  • Marketing Sales Funnel Described In Detail
  • Corporate Governance Best Practices
  • Business Performance Improvement
  • How Banks Make Money
  • Strategic Management Framework Diagram

Top 20 Tags

  • size (30)
  • cloud computing diagram (7)
  • food (7)
  • food chart (7)
  • food diagram (7)
  • skin (6)
  • cities (6)
  • world (6)
  • population (6)
  • conversion (6)
  • strategic planning tool (6)
  • cancer (5)
  • alcohol diagram (5)
  • business strategy diagram (5)
  • business model canvas (5)
  • sales process diagram (5)
  • strategic planning diagram (5)
  • agile project management (5)
  • leadership skills diagram (5)
  • car diagram (4)

Category

  • Anatomy
  • Business
  • Cancer
  • Clothes
  • Economy
  • Energy
  • Food
  • General
  • Health
  • IT
  • Military
  • Science
  • Sign
  • Sizes
  • Stress
  • Tools
  • Top
  • Women & Men
  • Workout
Copyright © 2026 Charts | Diagrams | Graphs. All Rights Reserved.
Theme: Catch Box by Catch Themes
Scroll Up