Category Archives: Business
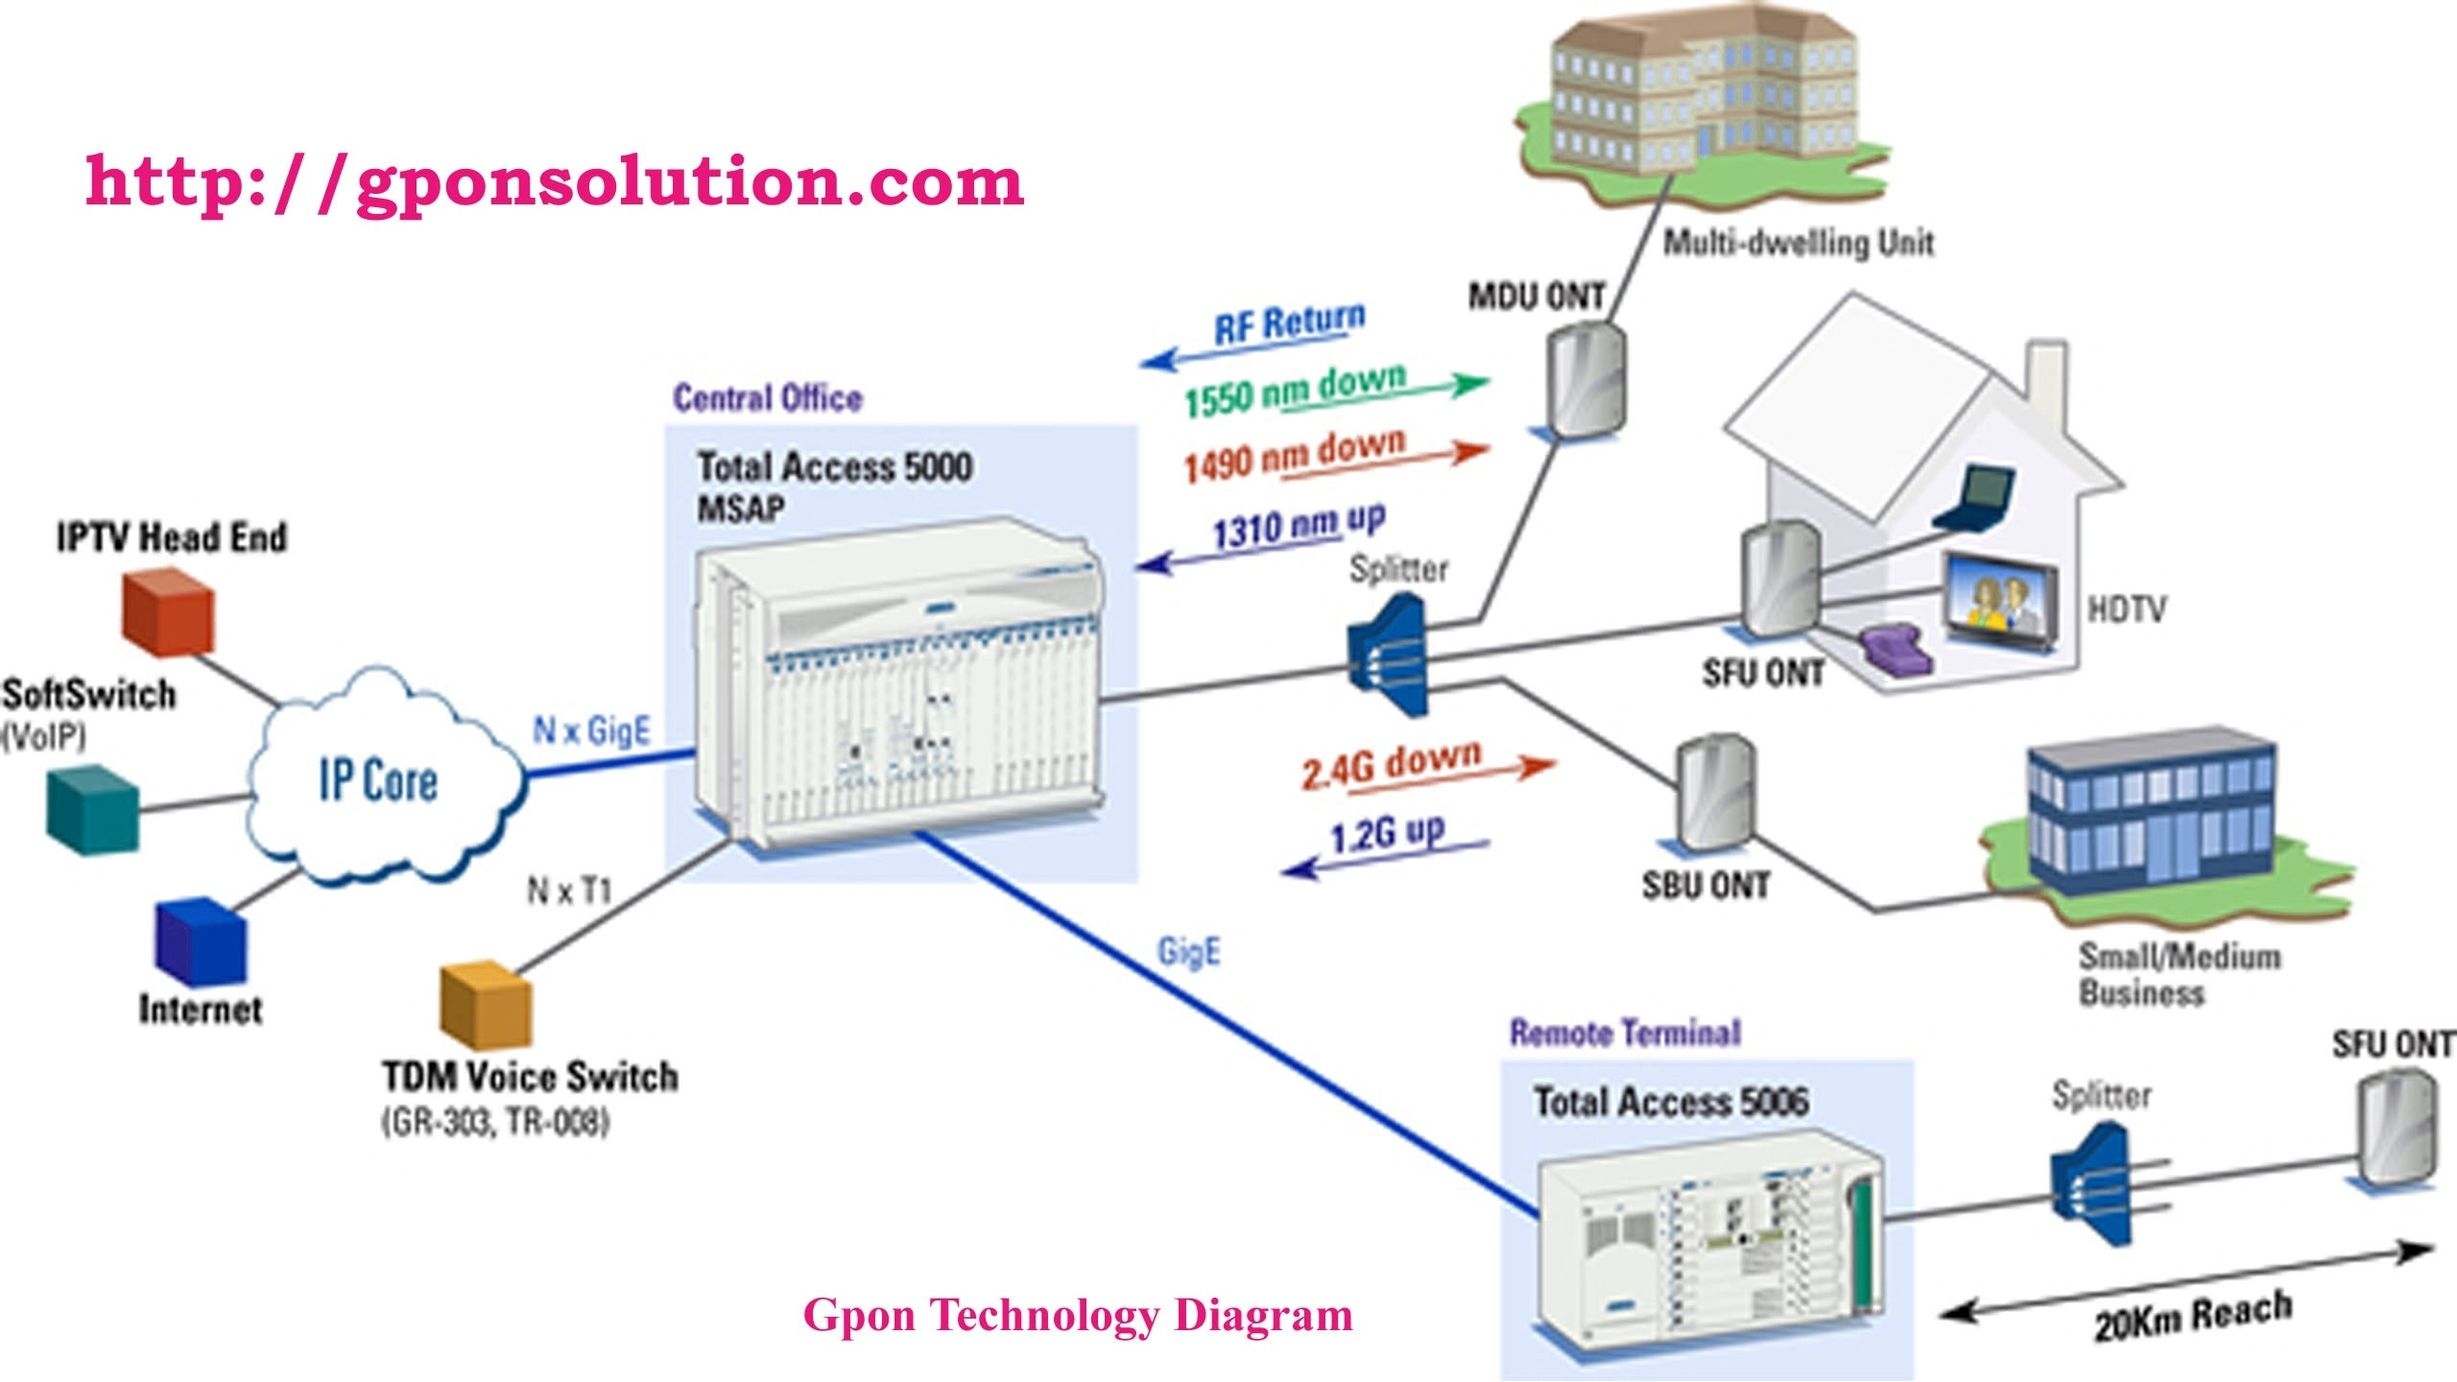
GPON Technology Diagram Overview
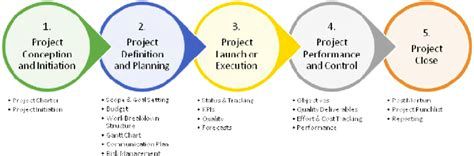
Phases of Project Management
Phases of Project Management: The phases of project management represent the stages through which a project progresses from initiation to completion. These phases typically include initiation, planning, execution, monitoring and controlling, and closing. Each phase ensures that projects are carefully managed, aligned with objectives, and delivered on time and within budget. The phases help maintain focus, manage resources effectively, and mitigate risks.
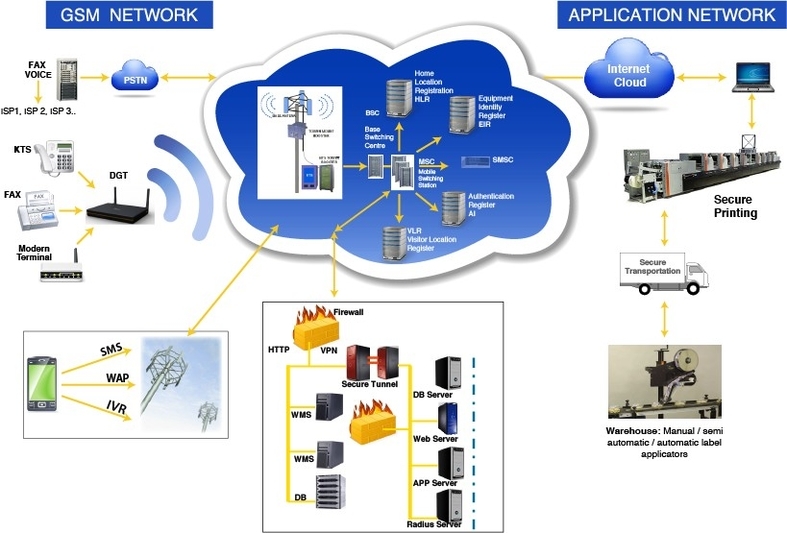
Technical Diagram
Technical Diagram: A Technical Diagram provides a visual representation of complex systems, processes, or structures. It is often used in engineering, IT, and architecture to communicate technical details and ensure clear understanding among stakeholders, enabling efficient design, implementation, and troubleshooting.
100 Day Action Plan Sample
100 Day Action Plan Sample: A 100-day action plan outlines the key initiatives and goals for the first 100 days of a new role or project. It typically includes setting priorities, building relationships, assessing the current state, identifying quick wins, and establishing a roadmap for long-term success. This plan helps new leaders or teams achieve early momentum and set the stage for sustained progress.
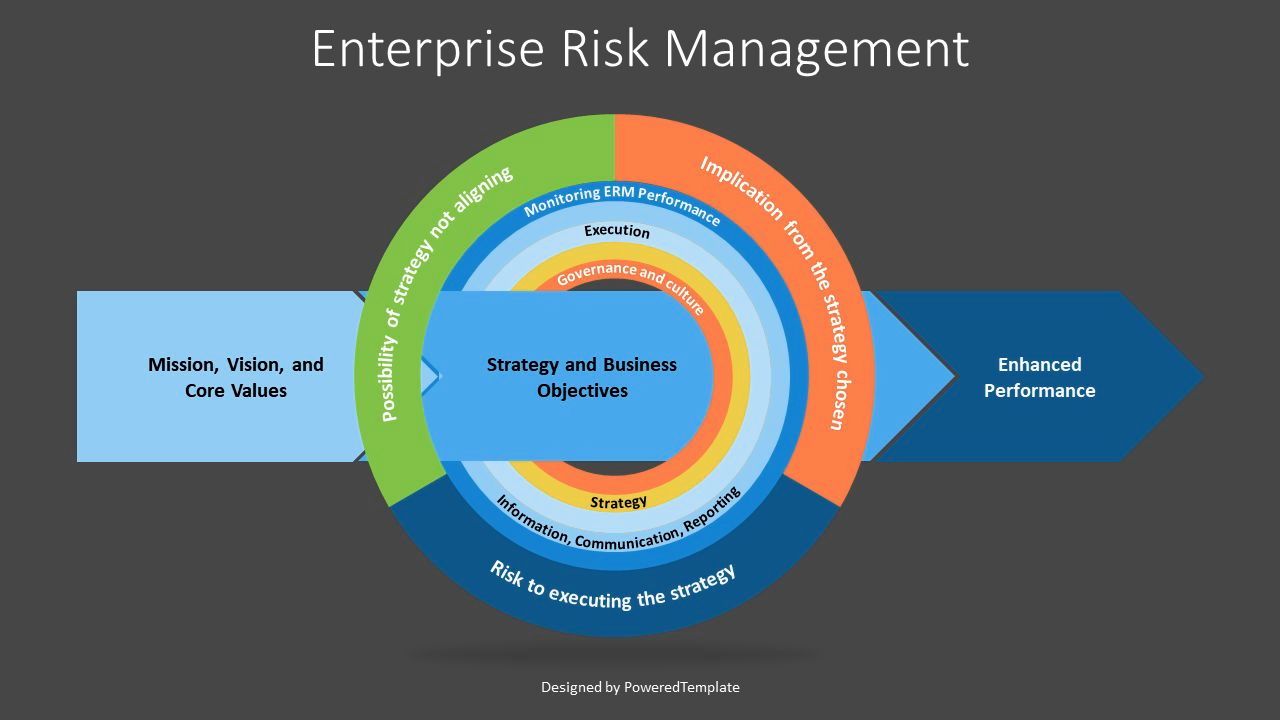
Enterprise risk management framework diagram free presentation
Enterprise risk management framework diagram free presentation: An enterprise risk management (ERM) framework diagram helps visualize how organizations identify, assess, mitigate, and monitor risks. These free presentation diagrams often include components like risk appetite, governance, compliance, and controls. They are essential tools for communicating risk strategy across departments and stakeholders.
Simple business analysis framework
Simple business analysis framework: A Simple Business Analysis Framework helps businesses analyze key factors impacting their operations and decision-making. It often includes steps like defining the problem, gathering data, identifying solutions, and evaluating alternatives. This framework ensures that decisions are informed, strategic, and aligned with organizational objectives.
HR KPI/HR KPI Metrics
HR KPI/HR KPI Metrics: HR Key Performance Indicators (KPIs) are metrics used to evaluate the effectiveness of human resources practices and strategies. Common HR KPIs include employee turnover rate, time-to-hire, employee engagement, and training effectiveness. By monitoring these metrics, organizations can optimize their workforce management, improve employee satisfaction, and align HR initiatives with overall business objectives.
Cloud Computing Diagram Described
Cloud Computing Diagram Described: A cloud computing diagram visually represents the architecture of cloud-based systems, illustrating the components and their interactions. It typically includes elements like client infrastructure, application services, storage, and security mechanisms, providing a comprehensive overview of how cloud services are structured and managed.
Business Process Improvement Approach
Business Process Improvement Approach: Business process improvement (BPI) is a systematic approach to enhancing the efficiency and effectiveness of business processes. It involves identifying, analyzing, and optimizing existing processes to eliminate waste, reduce costs, and improve quality. Common BPI methodologies include Lean, Six Sigma, and Total Quality Management (TQM). By continuously improving processes, organizations can achieve higher productivity and better customer satisfaction.