Skip to content
cropped cropped chart diagram1 2.png

Charts | Diagrams | Graphs

Charts | Diagrams | Graphs

Menu

Primary menu

  • Top
  • General
    • Upload Diagram
    • Sign
  • Business
  • Economy
  • Sizes
  • Anatomy
  • Health
    • Workout
    • Food
    • Stress
    • Cancer
  • IT
  • Science
    • Energy
  • Women & Men
    • Clothes
    • Military
    • Tools

St. Vincent and the Grenadines GDP per capita

Posted on May 13, 2025 by chartdiagram
St. Vincent and the Grenadines GDP per capita

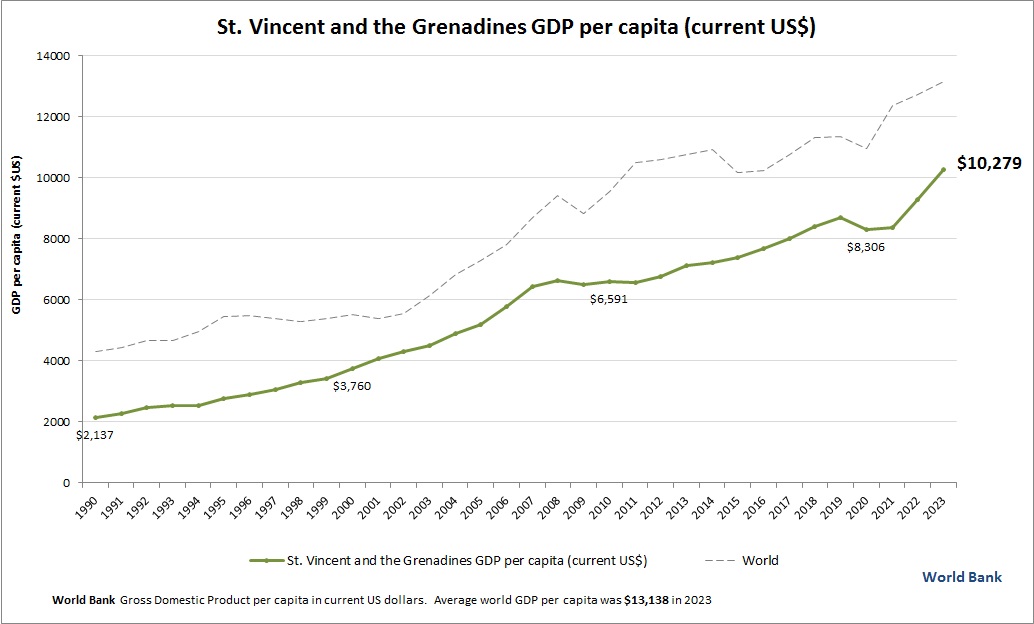
This graph shows St. Vincent and the Grenadines GDP per capita. This is according to World Bank GDP stats by country. Based on the latest available information for St. Vincent and the Grenadines.

Tags: St. Vincent and the Grenadines data, St. Vincent and the Grenadines economy, St. Vincent and the Grenadines GDP per person, St. Vincent and the Grenadines gross domestic product per capita, St. Vincent and the Grenadines statistics
This entry was posted in Economy and tagged St. Vincent and the Grenadines data, St. Vincent and the Grenadines economy, St. Vincent and the Grenadines GDP per person, St. Vincent and the Grenadines gross domestic product per capita, St. Vincent and the Grenadines statistics by chartdiagram. Bookmark the permalink.

Post navigation

← Previous Previous post: Dot And Cross Diagrams Of Ionic Bonding
Next → Next post: What is a PESTEL Analysis and Why It Matters

Primary Sidebar Widget Area

Top Diagrams

  • blood flow diagram Blood Flow Diagram

  • muscular system diagram Muscular System Diagram

  • Renaissance Art History Timeline Renaissance Art History Timeline

  • Greece GDP per capita Greece GDP per capita

  • Newton's Second Law Of Motion Newton’s Second Law Of Motion

  • Biology Diagrams Description Biology Diagrams Description

  • Blood Pressure By Age Blood Pressure By Age

  • Maslow’s Hierarchy of Needs

  • jflkdsjfklsdjfd jflkdsjfklsdjfd

  • Pounds to Kilograms – Kilograms to Pounds Chart

  • Real Number Set Diagram Real Number Set Diagram

  • Science Diagrams That Look Like Shitposts Science Diagrams That Look Like Shitposts

  • How Stress Affects Body How Stress Affects Body

  • Photosynthesis Diagram – Plants Photosynthesis Process

  • Fastener size chart Fastener size chart

  • shower diagram Shower Diagram

  • Color symbolism chart Color symbolism chart

  • circulatory system Circulatory System

  • Wellness

  • Turkmenistan GDP per capita Turkmenistan GDP per capita

Latest Posts

  • jflkdsjfklsdjfd
  • Greece GDP per capita
  • Business Canvas
  • Italy GDP per capita
  • 5 Whys of Lean
  • Turks and Caicos Islands GDP per capita
  • The Components of Leadership Action
  • Central Europe and the Baltics GDP per capita
  • Turkmenistan GDP per capita
  • McKinsey’s Portfolio of Initiatives Framework Template
  • Risk Analysis
  • Performance Management Infographic
  • Partnership Strategy Action Plan
  • Student leadership structure
  • Enterprise Framework

Top 20 Tags

  • size (30)
  • food (7)
  • food chart (7)
  • food diagram (7)
  • skin (6)
  • cities (6)
  • world (6)
  • population (6)
  • conversion (6)
  • cancer (5)
  • alcohol diagram (5)
  • sales process diagram (5)
  • car diagram (4)
  • water cycle (4)
  • stress (4)
  • how stress affects body (4)
  • yoga (4)
  • yoga poses (4)
  • yoga workout (4)
  • best yoga (4)

Category

  • Anatomy
  • Business
  • Cancer
  • Clothes
  • Economy
  • Energy
  • Food
  • General
  • Health
  • IT
  • Military
  • Science
  • Sign
  • Sizes
  • Stress
  • Tools
  • Top
  • Women & Men
  • Workout
Copyright © 2026 Charts | Diagrams | Graphs. All Rights Reserved.
Theme: Catch Box by Catch Themes
Scroll Up