Skip to content
cropped cropped chart diagram1 2.png

Charts | Diagrams | Graphs

Charts | Diagrams | Graphs

Menu

Primary menu

  • Top
  • General
    • Upload Diagram
    • Sign
  • Business
  • Economy
  • Sizes
  • Anatomy
  • Health
    • Workout
    • Food
    • Stress
    • Cancer
  • IT
  • Science
    • Energy
  • Women & Men
    • Clothes
    • Military
    • Tools

Tag Archives: green energy

Green Energy Diagram

Posted on May 21, 2021 by chartdiagram
Green Energy Diagram

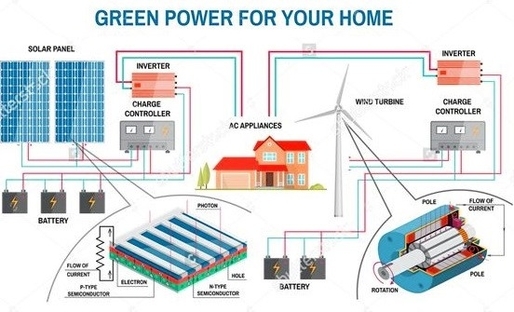
This diagram shows how green energy works. It explains and lists some of the key parts of the green energy setup including solar panels, battery, inverter and other components.

Posted in Energy | Tagged green energy, green energy diagram, green energy explained, green energy setup, how does green energy work

Primary Sidebar Widget Area

Top Diagrams

  • Smiley Faces

  • Human Evolution Human Evolution

  • Maslow’s Hierarchy of Needs

  • obesity chart Obesity Chart

  • Accounting Ratios Accounting Ratios

  • capsule size and weight chart Capsule size and weight chart

  • Plot Diagram

  • Standard Model Of Particle Physics 84 Standard Model Of Particle

  • Blockchain Security And Trustworthiness In Manufacturing Supply Chain Blockchain Security and Trustworthiness in Manufacturing Supply Chain

  • Math Problem Solving Math Problem Solving

  • Biology Diagrams Pdf Biology Diagrams Pdf

  • How does solar energy work How does solar energy work

  • What is scrum agile What is scrum agile

  • Kosovo GDP per capita Kosovo GDP per capita

  • object diagram Object Diagram

  • Organic Chemistry Reactions Organic Chemistry Reactions

  • Seven stage business process analysis framework Seven stage business process analysis framework

  • Women's Clothing Size Chart Women’s Clothing Size Chart

  • lungs diagram Lungs Diagram

  • Political Compass Chart Political Compass Chart

Latest Posts

  • Stress Management Mind Map Business Concept, Presentation Background
  • Mckinsey Three Horizons Of Growth Framework
  • Which Diagram Is Shown In The Technology?
  • Organizational Process of Change Management Presentation
  • Ways To Increase Employee Productivity
  • Vanuatu GDP per capita
  • Seven stage business process analysis framework
  • Population Graph
  • PESTLE Analysis Template PowerPoint
  • Mauritania GDP per capita
  • Strategic Planning Institutional Effectiveness
  • Blockchain Security and Trustworthiness in Manufacturing Supply Chain
  • Marketin Representation
  • Slovenia GDP per capita
  • Service Support Model

Top 20 Tags

  • size (30)
  • food (7)
  • food chart (7)
  • food diagram (7)
  • skin (6)
  • cities (6)
  • world (6)
  • population (6)
  • conversion (6)
  • cancer (5)
  • alcohol diagram (5)
  • sales process diagram (5)
  • car diagram (4)
  • water cycle (4)
  • stress (4)
  • how stress affects body (4)
  • yoga (4)
  • yoga poses (4)
  • yoga workout (4)
  • best yoga (4)

Category

  • Anatomy
  • Business
  • Cancer
  • Clothes
  • Economy
  • Energy
  • Food
  • General
  • Health
  • IT
  • Military
  • Science
  • Sign
  • Sizes
  • Stress
  • Tools
  • Top
  • Women & Men
  • Workout
Copyright © 2025 Charts | Diagrams | Graphs. All Rights Reserved.
Theme: Catch Box by Catch Themes
Scroll Up