Skip to content
cropped cropped chart diagram1 2.png

Charts | Diagrams | Graphs

Charts | Diagrams | Graphs

Menu

Primary menu

  • Top
  • General
    • Upload Diagram
    • Sign
  • Business
  • Economy
  • Sizes
  • Anatomy
  • Health
    • Workout
    • Food
    • Stress
    • Cancer
  • IT
  • Science
    • Energy
  • Women & Men
    • Clothes
    • Military
    • Tools

Central Europe and the Baltics GDP per capita

Posted on February 28, 2026 by chartdiagram
Central Europe and the Baltics GDP per capita

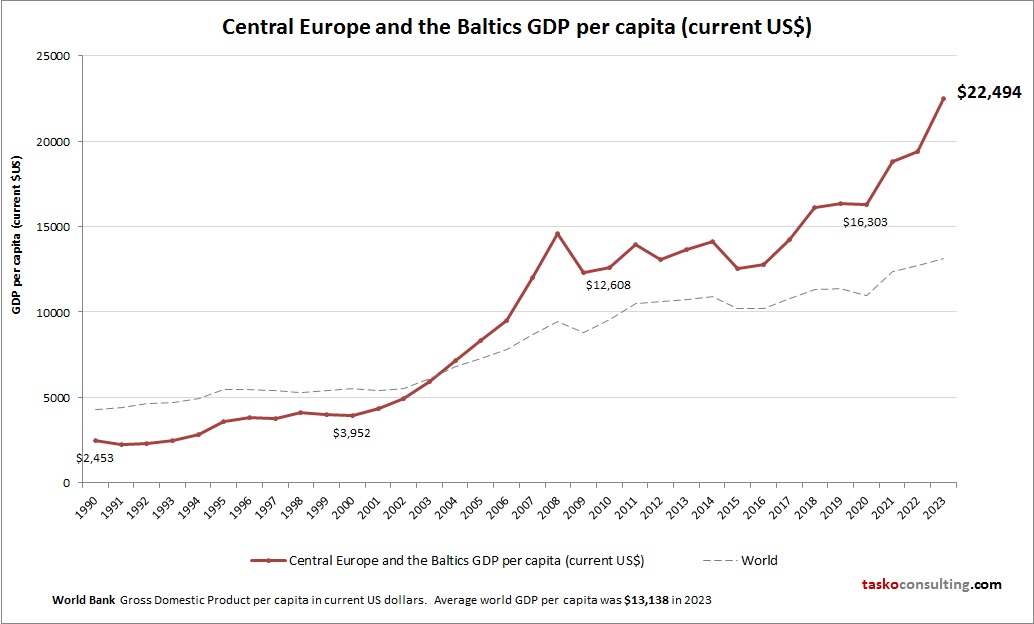
This chart demonstrates Central Europe and the Baltics GDP per capita. The gross domestic product statistics are compiled by World Bank. Latest GDP per person information for Central Europe and the Baltics.

Tags: Central Europe and the Baltics data, Central Europe and the Baltics economy, Central Europe and the Baltics GDP per person, Central Europe and the Baltics gross domestic product per capita, Central Europe and the Baltics statistics
This entry was posted in Economy and tagged Central Europe and the Baltics data, Central Europe and the Baltics economy, Central Europe and the Baltics GDP per person, Central Europe and the Baltics gross domestic product per capita, Central Europe and the Baltics statistics by chartdiagram. Bookmark the permalink.

Post navigation

← Previous Previous post: Turkmenistan GDP per capita
Next → Next post: The Components of Leadership Action

Primary Sidebar Widget Area

Top Diagrams

  • Stanford Design Thinking Process Stanford Design Thinking Process

  • Agile model of software development the development cycle Agile Model of Software Development the Development Cycle

  • Talent management vs human resource management Talent management vs human resource management

  • Microscope Diagram

  • Customer Journey Map Customer Journey Map

  • Business Intelligence Framework Process Infographic Business Intelligence Framework Process Infographic

  • shower diagram Shower Diagram

  • Modern circle diagram template for powerpoint Modern Circle Diagram Template for PowerPoint

  • Cloud Computing Architecture Diagram Cloud Computing Architecture Diagram

  • Timeline Template 26 Timeline Chart Template

  • Business Process Management Business Process Management

  • Eye Colors

  • Libya GDP per capita Libya GDP per capita

  • Physics Symbols Chart 92 Physics Symbols Explained

  • Agile scrum overview Agile Scrum Overview

  • Chicken parts Chicken parts

  • Physical Health Activity Nutrition Sleep Physical Health Activity Nutrition Sleep

  • Lesson Planning Lesson Planning

  • Sushi types Sushi types

  • circulatory system Circulatory System

Latest Posts

  • Modern Circle Diagram Template for PowerPoint
  • Afghanistan GDP per capita
  • Leadership and Management
  • Enterprise Business Architecture Framework
  • Human Excretory System Represented
  • BeFunky Collage
  • Adkar change management model google slides templates
  • Marketing Sales Funnel
  • Leadership Pyramid Leadership
  • Learning for Life Programme Community
  • Best change management images on pinterest
  • Leadership Diagram Circle
  • Business Concept Diagram
  • Eswatini GDP per capita
  • Cloud Computing Clarified

Top 20 Tags

  • size (30)
  • food (7)
  • food chart (7)
  • food diagram (7)
  • skin (6)
  • cities (6)
  • world (6)
  • population (6)
  • conversion (6)
  • cancer (5)
  • alcohol diagram (5)
  • business strategy diagram (5)
  • sales process diagram (5)
  • car diagram (4)
  • water cycle (4)
  • stress (4)
  • how stress affects body (4)
  • yoga (4)
  • yoga poses (4)
  • yoga workout (4)

Category

  • Anatomy
  • Business
  • Cancer
  • Clothes
  • Economy
  • Energy
  • Food
  • General
  • Health
  • IT
  • Military
  • Science
  • Sign
  • Sizes
  • Stress
  • Tools
  • Top
  • Women & Men
  • Workout
Copyright © 2026 Charts | Diagrams | Graphs. All Rights Reserved.
Theme: Catch Box by Catch Themes
Scroll Up