Skip to content
cropped cropped chart diagram1 2.png

Charts | Diagrams | Graphs

Charts | Diagrams | Graphs

Menu

Primary menu

  • Top
  • General
    • Upload Diagram
    • Sign
  • Business
  • Economy
  • Sizes
  • Anatomy
  • Health
    • Workout
    • Food
    • Stress
    • Cancer
  • IT
  • Science
    • Energy
  • Women & Men
    • Clothes
    • Military
    • Tools

Bank Account Management Data Flow

Posted on September 4, 2025 by chartdiagram
Bank Account Management Data Flow

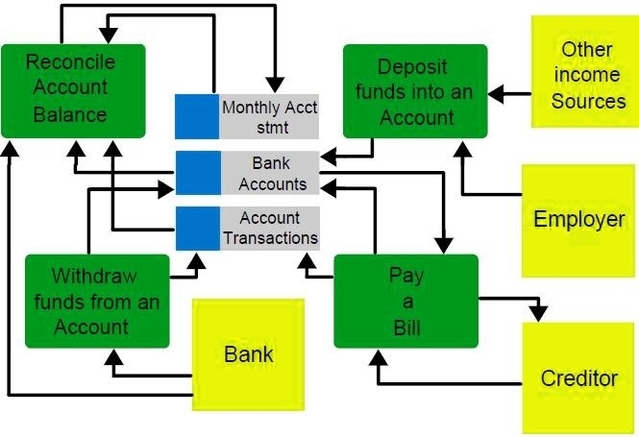
Bank Account Management Data Flow: This data flow diagram illustrates how information moves through a bank account management system. It includes inputs like account creation, transactions, and withdrawals, and shows how data is processed and stored for secure account management.

Tags: account management process, banking data flow diagram, banking workflow visual, DFD banking system, transaction flow model
This entry was posted in Business and tagged account management process, banking data flow diagram, banking workflow visual, DFD banking system, transaction flow model by chartdiagram. Bookmark the permalink.

Post navigation

← Previous Previous post: Change management framework powerpoint template slide
Next → Next post: Convex Lens Ray Diagram Worksheet

Primary Sidebar Widget Area

Top Diagrams

  • Seychelles GDP per capita Seychelles GDP per capita

  • Renaissance Art History Timeline Renaissance Art History Timeline

  • Atom Diagram

  • obesity chart Obesity Chart

  • Agile scrum an overview on process and planning Agile scrum an overview on process and planning

  • Computer Science Diagram 76 Computer Science Flow Diagram

  • Economic Systems Of The Future Economic Systems Of The Future

  • Stanford Design Thinking Process Stanford Design Thinking Process

  • North Macedonia GDP per capita North Macedonia GDP per capita

  • Plant cell explained Plant cell explained

  • Leader followers goals Leader Followers Goals

  • Political Compass Chart Political Compass Chart

  • Porters Value Chain Model Porter’s Value Chain Model

  • Framework Analysis Framework Analysis

  • Technology Vs Humanity Venn Diagram Technology vs Humanity Venn Diagram

  • Women's Clothing Size Chart Women’s Clothing Size Chart

  • Strategic partnership development Strategic Partnership Development

  • Nauru GDP per capita Nauru GDP per capita

  • essay structure Essay Structure

  • Agile and model based design for engineering software development Agile and model based design for engineering software development

Latest Posts

  • Business Strategy Frameworks
  • Employee Engagement Surveys The Right Group
  • Physics Formulas
  • Agile and model based design for engineering software development
  • Leader Followers Goals
  • Agile scrum an overview on process and planning
  • Economic Systems Of The Future
  • Framework Analysis
  • North Macedonia GDP per capita
  • Cash Flow Chart
  • Technology vs Humanity Venn Diagram
  • Plant cell explained
  • Nauru GDP per capita
  • Strategic Partnership Development
  • Market intelligence analysis marketing strategy

Top 20 Tags

  • size (30)
  • food (7)
  • food chart (7)
  • food diagram (7)
  • skin (6)
  • cities (6)
  • world (6)
  • population (6)
  • conversion (6)
  • cancer (5)
  • alcohol diagram (5)
  • sales process diagram (5)
  • car diagram (4)
  • water cycle (4)
  • stress (4)
  • how stress affects body (4)
  • yoga (4)
  • yoga poses (4)
  • yoga workout (4)
  • best yoga (4)

Category

  • Anatomy
  • Business
  • Cancer
  • Clothes
  • Economy
  • Energy
  • Food
  • General
  • Health
  • IT
  • Military
  • Science
  • Sign
  • Sizes
  • Stress
  • Tools
  • Top
  • Women & Men
  • Workout
Copyright © 2026 Charts | Diagrams | Graphs. All Rights Reserved.
Theme: Catch Box by Catch Themes
Scroll Up