Skip to content
cropped cropped chart diagram1 2.png

Charts | Diagrams | Graphs

Charts | Diagrams | Graphs

Menu

Primary menu

  • Top
  • General
    • Upload Diagram
    • Sign
  • Business
  • Economy
  • Sizes
  • Anatomy
  • Health
    • Workout
    • Food
    • Stress
    • Cancer
  • IT
  • Science
    • Energy
  • Women & Men
    • Clothes
    • Military
    • Tools

Tag Archives: Austria statistics

Austria GDP per capita

Posted on October 22, 2025 by chartdiagram
Austria GDP per capita

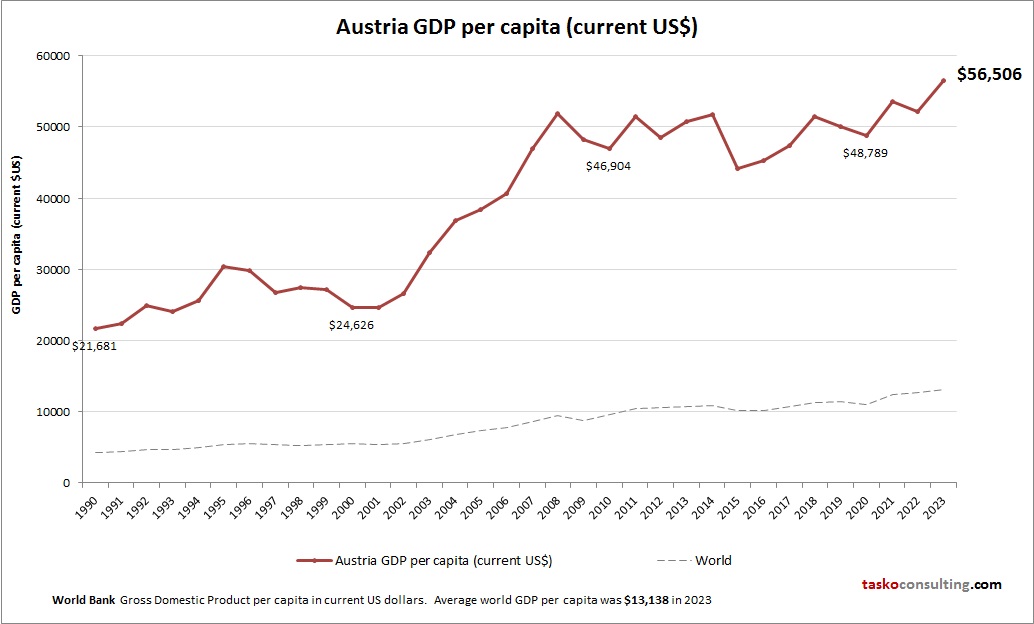
This diagram presents Austria GDP per capita. World Bank is the source of this economic data. Based on the latest economic info provided for Austria.

Posted in Economy | Tagged Austria data, Austria economy, Austria GDP per person, Austria gross domestic product per capita, Austria statistics

Primary Sidebar Widget Area

Top Diagrams

  • Color symbolism chart Color symbolism chart

  • Atom Diagram

  • World Geography Map World Geography Map

  • Porters five forces analysis for food manufacturers Porter’s Five Forces Analysis for Food Manufacturers

  • Car Diagram

  • Colon Cancer Signs Colon Cancer Signs

  • Ecuador GDP per capita Ecuador GDP per capita

  • Role of Process Engineering What Is the Role of Process Engineering in the Service Industry?

  • bust cup size diagram Bust cup size diagram

  • Change management framework powerpoint slide presentation tips Change Management Framework PowerPoint Slide Presentation Tips

  • circulatory system Circulatory System

  • Inside Sales Process Flowchart Inside Sales Process Flowchart

  • Business analysis practice maturity model Business Analysis Practice Maturity Model

  • Business Architecture Domain Business Architecture Domain

  • Blood Pressure By Age Blood Pressure By Age

  • Organisational leadership Organisational Leadership

  • RACI Chart RACI Chart

  • Uq leadership framework human resources UQ Leadership Framework Human Resources

  • Pragmatic Marketing Framework Pragmatic Marketing Framework

  • Hr Kpishr Kpi Metrics HR KPI/HR KPI Metrics

Latest Posts

  • Cabo Verde GDP per capita
  • World Geography Map
  • RACI Chart
  • Leadership levels diagram template
  • Sales And Marketing Org Chart Template
  • Maloney’s Diffusion of Innovation
  • Agile Framework
  • Strategy Services Include a Focus on Change Management
  • Security Triangle
  • Digital Transformation Wheel
  • Vision And Strategy Framework
  • Digital Transformation Process
  • Neuroscience Leadership Culture
  • Life Cycle Diagram of the Real Estate
  • Hybrid agile framework. download scientific diagram

Top 20 Tags

  • size (30)
  • food (7)
  • food chart (7)
  • food diagram (7)
  • skin (6)
  • cities (6)
  • world (6)
  • population (6)
  • conversion (6)
  • cancer (5)
  • alcohol diagram (5)
  • sales process diagram (5)
  • car diagram (4)
  • water cycle (4)
  • stress (4)
  • how stress affects body (4)
  • yoga (4)
  • yoga poses (4)
  • yoga workout (4)
  • best yoga (4)

Category

  • Anatomy
  • Business
  • Cancer
  • Clothes
  • Economy
  • Energy
  • Food
  • General
  • Health
  • IT
  • Military
  • Science
  • Sign
  • Sizes
  • Stress
  • Tools
  • Top
  • Women & Men
  • Workout
Copyright © 2026 Charts | Diagrams | Graphs. All Rights Reserved.
Theme: Catch Box by Catch Themes
Scroll Up