Skip to content
cropped cropped chart diagram1 2.png

Charts | Diagrams | Graphs

Charts | Diagrams | Graphs

Menu

Primary menu

  • Top
  • General
    • Upload Diagram
    • Sign
  • Business
  • Economy
  • Sizes
  • Anatomy
  • Health
    • Workout
    • Food
    • Stress
    • Cancer
  • IT
  • Science
    • Energy
  • Women & Men
    • Clothes
    • Military
    • Tools

Tag Archives: business environment analysis

PESTLE Analysis Template PowerPoint

Posted on December 13, 2025 by chartdiagram
Pestle analysis template powerpoint

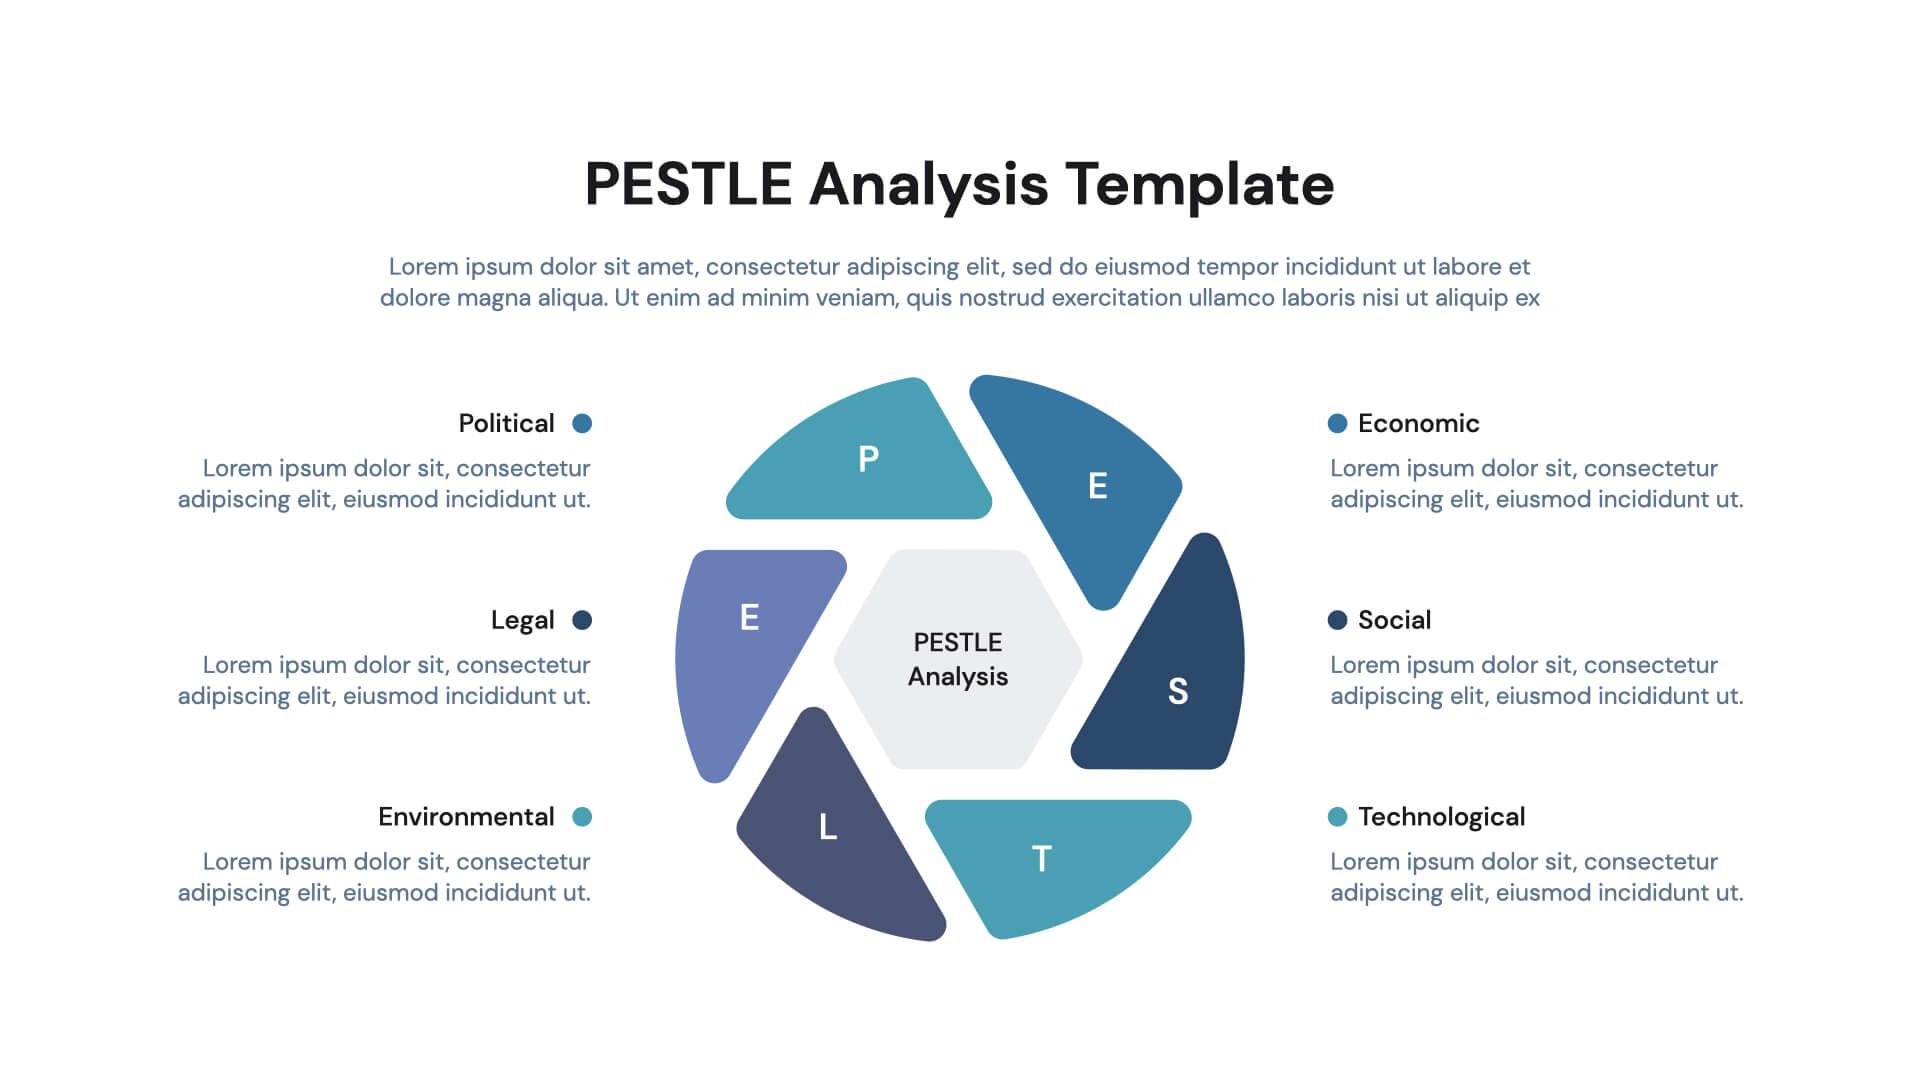
PESTLE Analysis Template PowerPoint: This slide template lets users visually present Political, Economic, Social, Technological, Legal, and Environmental factors influencing their business—essential for strategic planning.

Posted in Business | Tagged business environment analysis, market environment model, PESTLE analysis slide, PESTLE factors template, PESTLE framework PowerPoint

PESTLE Framework for MBA Students

Posted on April 26, 2025 by chartdiagram
Pestle framework for mba students

PESTLE Framework for MBA Students: The PESTLE framework helps MBA students analyze external factors affecting an organization: Political, Economic, Social, Technological, Legal, and Environmental. It is a key strategic tool in business planning.

Posted in Business | Tagged business environment analysis, market analysis PESTLE, MBA PESTLE framework, PESTLE analysis model, strategic planning tool

Primary Sidebar Widget Area

Top Diagrams

  • Features Of Democracy Graphic Organizer Features Of Democracy Graphic Organizer

  • Competency Framework Competency Framework

  • Transformational leadership model Transformational Leadership Model

  • Amazon Web Services Amazon Web Services

  • Farming Diagramfarm Diagram 2 Farming Illustration Diagram

  • What does agile mean in software development What does agile mean in software development

  • SWOT Analysis

  • Women's Clothing Size Chart Women’s Clothing Size Chart

  • World Gdpworld Economy Gdp World Economy Gdp

  • Post demographic dividend GDP per capita Post demographic dividend GDP per capita

  • motherboard diagram Motherboard Diagram

  • Marketin Marketing

  • The core components of leadership The Core Components of Leadership

  • Flowchart of project implementation Flowchart of Project Implementation

  • Chemical Elements Chemical Elements

  • Design Tech Intl Wiring Diagram Design Tech Intl Wiring Diagram

  • Business Process Modeling With Conceptdraw Business Process Modeling with ConceptDraw

  • value stream map Value Stream Map

  • Project management scrum methodology Project management scrum methodology

  • Model Governance Framework Model Governance Framework

Latest Posts

  • Timor Leste GDP per capita
  • Business Model Canvas Sample Of
  • How to Manage the People Side of Business
  • Project management scrum methodology
  • Business Process Modeling with ConceptDraw
  • Strategic Planning Models Infographic
  • The Core Components of Leadership
  • Marketing
  • Farming Illustration Diagram
  • Model Governance Framework
  • Flowchart of Project Implementation
  • Post demographic dividend GDP per capita
  • Amazon Web Services
  • Chemical Elements
  • 1998 Drucker School of Management Org Chart

Top 20 Tags

  • size (30)
  • food (7)
  • food chart (7)
  • food diagram (7)
  • skin (6)
  • cities (6)
  • world (6)
  • population (6)
  • conversion (6)
  • cancer (5)
  • alcohol diagram (5)
  • sales process diagram (5)
  • car diagram (4)
  • water cycle (4)
  • stress (4)
  • how stress affects body (4)
  • yoga (4)
  • yoga poses (4)
  • yoga workout (4)
  • best yoga (4)

Category

  • Anatomy
  • Business
  • Cancer
  • Clothes
  • Economy
  • Energy
  • Food
  • General
  • Health
  • IT
  • Military
  • Science
  • Sign
  • Sizes
  • Stress
  • Tools
  • Top
  • Women & Men
  • Workout
Copyright © 2026 Charts | Diagrams | Graphs. All Rights Reserved.
Theme: Catch Box by Catch Themes
Scroll Up