Skip to content
cropped cropped chart diagram1 2.png

Charts | Diagrams | Graphs

Charts | Diagrams | Graphs

Menu

Primary menu

  • Top
  • General
    • Upload Diagram
    • Sign
  • Business
  • Economy
  • Sizes
  • Anatomy
  • Health
    • Workout
    • Food
    • Stress
    • Cancer
  • IT
  • Science
    • Energy
  • Women & Men
    • Clothes
    • Military
    • Tools

Tag Archives: CX improvement

Customer Service Standards

Posted on May 11, 2025 by chartdiagram
Customer Service Standards

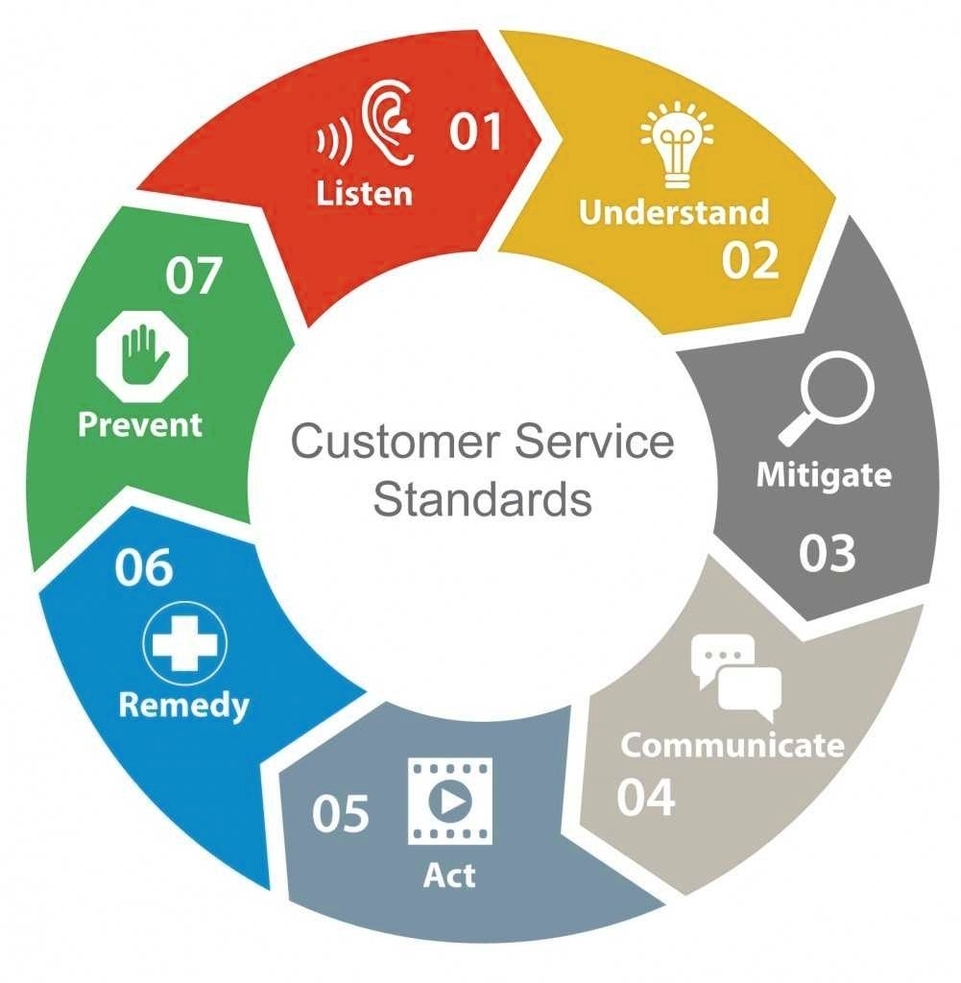
Customer Service Standards: Customer Service Standards define the expected level of service delivery across interactions. These can include response time, courtesy, resolution rates, and communication tone—guiding teams to consistently meet or exceed customer expectations.

Posted in Business | Tagged customer satisfaction model, customer service framework, CX improvement, service quality standards, support best practices

Primary Sidebar Widget Area

Top Diagrams

  • Agile methodology revolutionizing project management Agile methodology revolutionizing project management

  • tree diagram 1 Tree Diagram

  • shoe size chart Shoe Size Chart

  • Project roles and responsibilities Project roles and responsibilities

  • Antigua and Barbuda GDP per capita Antigua and Barbuda GDP per capita

  • Plant Cell Diagram

  • Situational leadership model powerpoint Situational leadership model powerpoint

  • Talent management framework human resource Talent Management Framework Human Resource

  • Consulting change management framework Consulting Change Management Framework

  • Renaissance Art History Timeline Renaissance Art History Timeline

  • Women's Clothing Size Chart Women’s Clothing Size Chart

  • the three major cloud service models The Three Major Cloud Service Models

  • Agile scrum methodology in software development Agile scrum methodology in software development

  • Manufacturing Flow Manufacturing Flow

  • Isle of Man GDP per capita Isle of Man GDP per capita

  • Porters Value Chain Model Porter’s Value Chain Model

  • Scientific Test Tubes Scientific Test Tubes

  • obesity chart Obesity Chart

  • Processing Payment at a POS Processing Payment At A POS

  • capsule size and weight chart Capsule size and weight chart

Latest Posts

  • Porter’s Value Chain Model
  • Ecuador GDP per capita
  • Antigua and Barbuda GDP per capita
  • Agile scrum methodology in software development
  • Project Plan Review Workflow Diagram
  • Consulting Change Management Framework
  • Seychelles GDP per capita
  • Project roles and responsibilities
  • Situational leadership model powerpoint
  • Talent Management Framework Human Resource
  • Isle of Man GDP per capita
  • Cloud Service Models
  • HS Strategic Planning Framework For Health And Safety Legislation
  • Scrum Diagram
  • Manufacturing Flow

Top 20 Tags

  • size (30)
  • food (7)
  • food chart (7)
  • food diagram (7)
  • skin (6)
  • cities (6)
  • world (6)
  • population (6)
  • conversion (6)
  • cancer (5)
  • alcohol diagram (5)
  • sales process diagram (5)
  • car diagram (4)
  • water cycle (4)
  • stress (4)
  • how stress affects body (4)
  • yoga (4)
  • yoga poses (4)
  • yoga workout (4)
  • best yoga (4)

Category

  • Anatomy
  • Business
  • Cancer
  • Clothes
  • Economy
  • Energy
  • Food
  • General
  • Health
  • IT
  • Military
  • Science
  • Sign
  • Sizes
  • Stress
  • Tools
  • Top
  • Women & Men
  • Workout
Copyright © 2026 Charts | Diagrams | Graphs. All Rights Reserved.
Theme: Catch Box by Catch Themes
Scroll Up