Skip to content
cropped cropped chart diagram1 2.png

Charts | Diagrams | Graphs

Charts | Diagrams | Graphs

Menu

Primary menu

  • Top
  • General
    • Upload Diagram
    • Sign
  • Business
  • Economy
  • Sizes
  • Anatomy
  • Health
    • Workout
    • Food
    • Stress
    • Cancer
  • IT
  • Science
    • Energy
  • Women & Men
    • Clothes
    • Military
    • Tools

Tag Archives: Eswatini economy

Eswatini GDP per capita

Posted on April 8, 2026 by chartdiagram
Eswatini GDP per capita

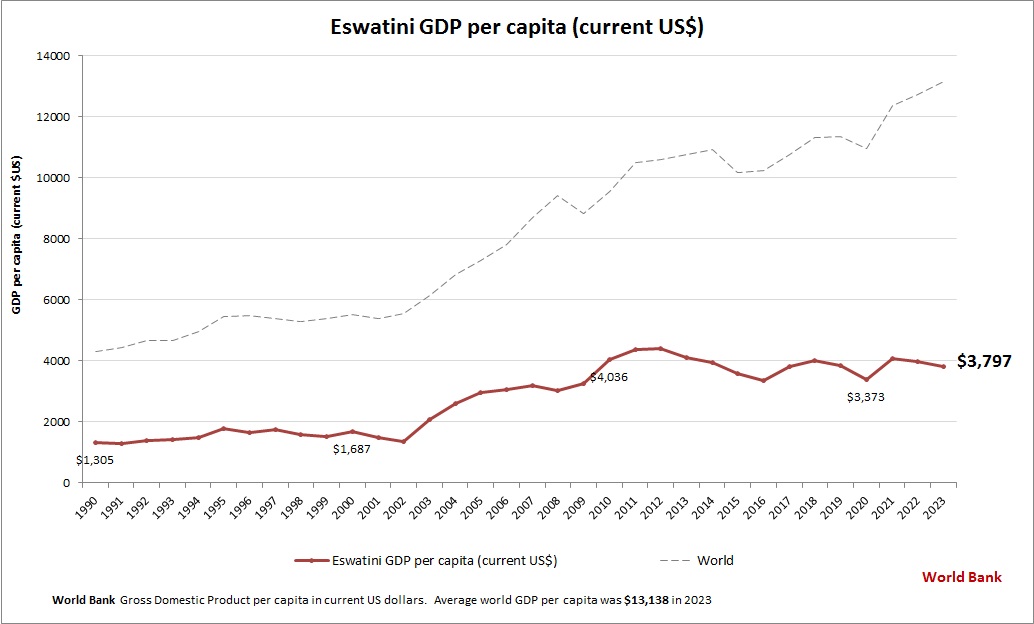
This chart demonstrates Eswatini GDP per capita. The gross domestic product statistics are compiled by World Bank. Based on the latest economic info provided for Eswatini.

Posted in Economy | Tagged Eswatini data, Eswatini economy, Eswatini GDP per person, Eswatini gross domestic product per capita, Eswatini statistics

Primary Sidebar Widget Area

Top Diagrams

  • Artificial Intelligence AI Technique Artificial Intelligence AI Technique
  • marketing macro environment Marketing Macro Environment
  • muscular system diagram Muscular System Diagram
  • Estrogen rich food chart Estrogen rich food chart
  • Agile framework illustrated Agile Framework Illustrated
  • Myanmar GDP per capita Myanmar GDP per capita
  • Technical Architecture Layers Technical Architecture Layers
  • Body Diagram Physics Body Diagram Physics
  • Uq leadership framework human resources UQ Leadership Framework Human Resources
  • Whats the difference between agile and devops What’s the Difference Between Agile and DevOps
  • preschool sizing chart Preschool sizing chart
  • Republic of the Congo GDP per capita Republic of the Congo GDP per capita
  • Journey Map Sample Journey Map Sample
  • Channel Islands GDP per capita Channel Islands GDP per capita
  • web diagram Web Diagram
  • Manufacturing Flow Manufacturing Flow
  • How to prune a tree How to prune a tree
  • Regenerative Agriculture 51 Regenerative Agriculture Diagram
  • Farmer Diagram 8 Farming Diagram
  • tornado diagram Tornado Diagram

Latest Posts

  • Process Efficiency Analysis
  • Marketing Macro Environment
  • Tree Diagram Software
  • Aruba GDP per capita
  • What’s the Difference Between Agile and DevOps
  • How leadership emotional intelligence
  • Camera Lens Diagram
  • Operating Model
  • Diagram of Leadership Skills
  • 3d Printing Kpis
  • Agile Frameworks
  • Kyrgyzstan GDP per capita
  • Leadership Strategy and Delivery
  • Competency-Based HR Management PPT Slides
  • Cayman Islands GDP per capita

Top 20 Tags

  • size (30)
  • food (7)
  • food chart (7)
  • food diagram (7)
  • skin (6)
  • cities (6)
  • world (6)
  • population (6)
  • conversion (6)
  • cancer (5)
  • alcohol diagram (5)
  • business strategy diagram (5)
  • sales process diagram (5)
  • leadership skills diagram (5)
  • car diagram (4)
  • cloud computing diagram (4)
  • water cycle (4)
  • stress (4)
  • how stress affects body (4)
  • yoga (4)

Category

  • Anatomy
  • Business
  • Cancer
  • Clothes
  • Economy
  • Energy
  • Food
  • General
  • Health
  • IT
  • Military
  • Science
  • Sign
  • Sizes
  • Stress
  • Tools
  • Top
  • Women & Men
  • Workout
Copyright © 2026 Charts | Diagrams | Graphs. All Rights Reserved.
Theme: Catch Box by Catch Themes
Scroll Up