Skip to content
cropped cropped chart diagram1 2.png

Charts | Diagrams | Graphs

Charts | Diagrams | Graphs

Menu

Primary menu

  • Top
  • General
    • Upload Diagram
    • Sign
  • Business
  • Economy
  • Sizes
  • Anatomy
  • Health
    • Workout
    • Food
    • Stress
    • Cancer
  • IT
  • Science
    • Energy
  • Women & Men
    • Clothes
    • Military
    • Tools

Tag Archives: lead generation chart

Sales Diagram Illustration

Posted on May 22, 2025 by chartdiagram
Sales Diagram Illustration

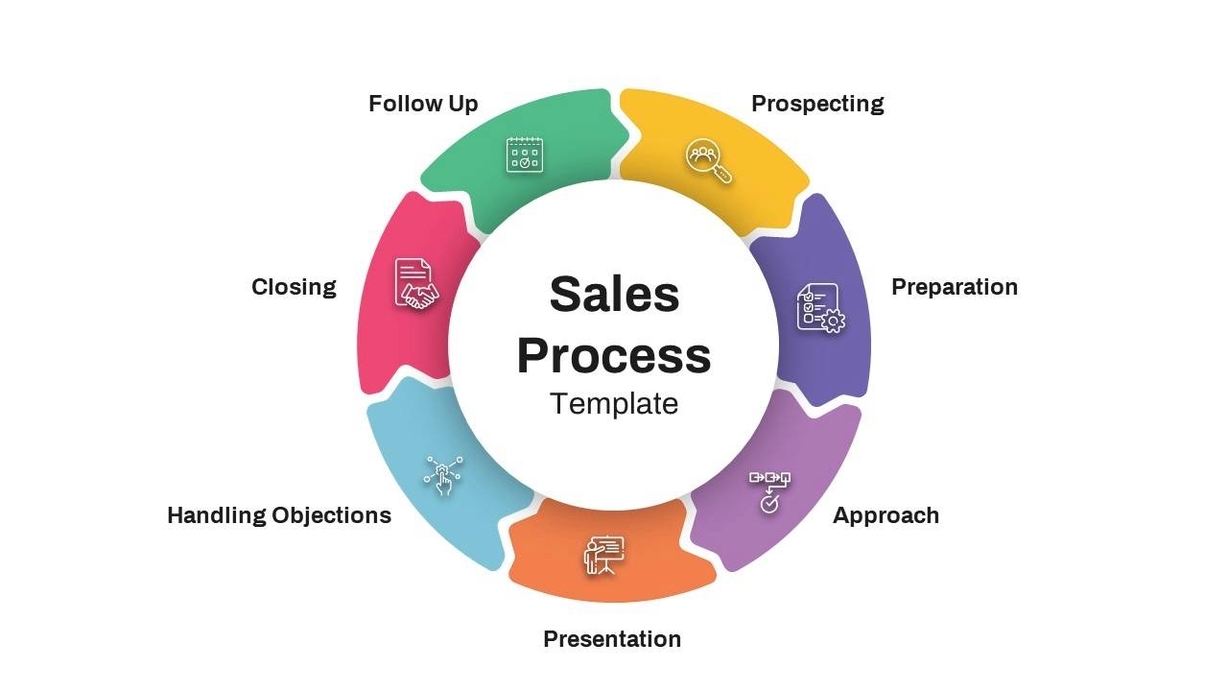
Sales Diagram Illustration: A sales diagram illustration visually represents the stages of the sales process, from lead generation to closing deals. It helps sales teams understand the flow of activities and identify areas for improvement to increase sales effectiveness.

Posted in Business | Tagged customer journey illustration, lead generation chart, sales funnel visual, sales process diagram, selling strategy graphic

Primary Sidebar Widget Area

Top Diagrams

  • Features Of Democracy Graphic Organizer Features Of Democracy Graphic Organizer

  • Competency Framework Competency Framework

  • Transformational leadership model Transformational Leadership Model

  • Amazon Web Services Amazon Web Services

  • Farming Diagramfarm Diagram 2 Farming Illustration Diagram

  • What does agile mean in software development What does agile mean in software development

  • Marketin Marketing

  • Women's Clothing Size Chart Women’s Clothing Size Chart

  • SWOT Analysis

  • motherboard diagram Motherboard Diagram

  • Project management scrum methodology Project management scrum methodology

  • The core components of leadership The Core Components of Leadership

  • World Gdpworld Economy Gdp World Economy Gdp

  • Post demographic dividend GDP per capita Post demographic dividend GDP per capita

  • Chemical Elements Chemical Elements

  • Design Tech Intl Wiring Diagram Design Tech Intl Wiring Diagram

  • Business Process Modeling With Conceptdraw Business Process Modeling with ConceptDraw

  • Flowchart of project implementation Flowchart of Project Implementation

  • value stream map Value Stream Map

  • Model Governance Framework Model Governance Framework

Latest Posts

  • Timor Leste GDP per capita
  • Business Model Canvas Sample Of
  • How to Manage the People Side of Business
  • Project management scrum methodology
  • Business Process Modeling with ConceptDraw
  • Strategic Planning Models Infographic
  • The Core Components of Leadership
  • Marketing
  • Farming Illustration Diagram
  • Model Governance Framework
  • Flowchart of Project Implementation
  • Post demographic dividend GDP per capita
  • Amazon Web Services
  • Chemical Elements
  • 1998 Drucker School of Management Org Chart

Top 20 Tags

  • size (30)
  • food (7)
  • food chart (7)
  • food diagram (7)
  • skin (6)
  • cities (6)
  • world (6)
  • population (6)
  • conversion (6)
  • cancer (5)
  • alcohol diagram (5)
  • sales process diagram (5)
  • car diagram (4)
  • water cycle (4)
  • stress (4)
  • how stress affects body (4)
  • yoga (4)
  • yoga poses (4)
  • yoga workout (4)
  • best yoga (4)

Category

  • Anatomy
  • Business
  • Cancer
  • Clothes
  • Economy
  • Energy
  • Food
  • General
  • Health
  • IT
  • Military
  • Science
  • Sign
  • Sizes
  • Stress
  • Tools
  • Top
  • Women & Men
  • Workout
Copyright © 2026 Charts | Diagrams | Graphs. All Rights Reserved.
Theme: Catch Box by Catch Themes
Scroll Up