Skip to content
cropped cropped chart diagram1 2.png

Charts | Diagrams | Graphs

Charts | Diagrams | Graphs

Menu

Primary menu

  • Top
  • General
    • Upload Diagram
    • Sign
  • Business
  • Economy
  • Sizes
  • Anatomy
  • Health
    • Workout
    • Food
    • Stress
    • Cancer
  • IT
  • Science
    • Energy
  • Women & Men
    • Clothes
    • Military
    • Tools

Tag Archives: workflow efficiency visual

Improving Processes

Posted on October 15, 2025 by chartdiagram
Improving Processes

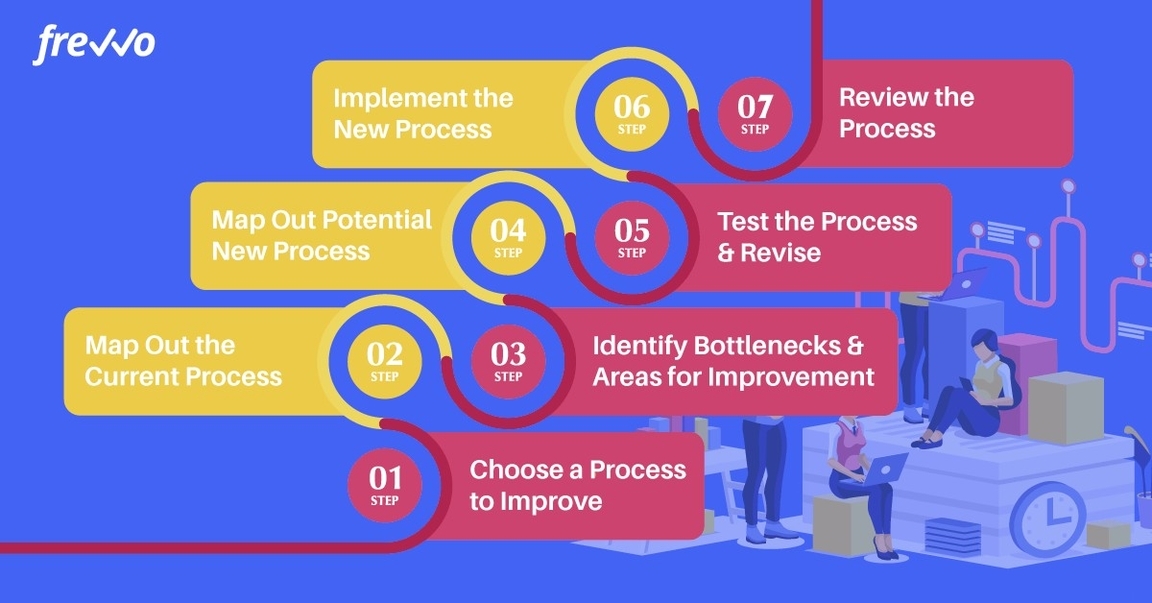
Improving Processes: Improving processes involves analyzing current workflows, identifying inefficiencies, and implementing changes to streamline operations and increase productivity.

Posted in Business | Tagged business optimization strategy, lean transformation, performance boost plan, process improvement diagram, workflow efficiency visual

Primary Sidebar Widget Area

Top Diagrams

  • Plot Diagram

  • Eye Colors

  • Ukraine GDP per capita Ukraine GDP per capita

  • Scrum and agile software development know the difference Scrum and agile software development know the difference

  • Nigeria Economic Pie Chart Nigeria Economic Pie Chart

  • bmi in pounds BMI in Pounds

  • Political Compass Chart Political Compass Chart

  • Sports bra size chart scaled Sports bra size chart

  • Timeline Of World History Pdf Timeline Of World History Pdf

  • Pareto Diagram – Pareto Chart

  • Cooking verbs diagram Cooking Words Diagram

  • Mens boxer briefs size chart Mens boxer briefs size chart

  • muscular system diagram Muscular System Diagram

  • Regenerative Agriculture 54 What is Regenerative Agriculture

  • Class Diagram

  • Types of Skin Cancer Types of Skin Cancer

  • Process Map Symbols Process Map Symbols

  • Leadership Diagram Leadership Diagram

  • Agile frameworks scrum vs kanban Agile Frameworks Scrum vs Kanban

  • frame size seat height chart Bike Frame Size and Seat Height Chart

Latest Posts

  • Law Firm Breach Prevention
  • Ukraine GDP per capita
  • Scrum and agile software development know the difference
  • Pacific island small states GDP per capita
  • Project management process with circle
  • Strategy Map Powerpoint Diagram
  • Adkar change management template
  • Europe Central Asia GDP per capita
  • Project schedule network diagram
  • B2B Business Marketing Framework
  • Monaco GDP per capita
  • Porters five forces analysis for food manufacturers Sample
  • Artificial Intelligence Map Of Cell Types
  • How to Achieve Investors in People
  • Comparison And Contrast In An Essay

Top 20 Tags

  • size (30)
  • food (7)
  • food chart (7)
  • food diagram (7)
  • skin (6)
  • cities (6)
  • world (6)
  • population (6)
  • conversion (6)
  • cancer (5)
  • alcohol diagram (5)
  • sales process diagram (5)
  • car diagram (4)
  • water cycle (4)
  • stress (4)
  • how stress affects body (4)
  • yoga (4)
  • yoga poses (4)
  • yoga workout (4)
  • best yoga (4)

Category

  • Anatomy
  • Business
  • Cancer
  • Clothes
  • Economy
  • Energy
  • Food
  • General
  • Health
  • IT
  • Military
  • Science
  • Sign
  • Sizes
  • Stress
  • Tools
  • Top
  • Women & Men
  • Workout
Copyright © 2026 Charts | Diagrams | Graphs. All Rights Reserved.
Theme: Catch Box by Catch Themes
Scroll Up