Skip to content
Charts | Diagrams | Graphs
Charts | Diagrams | Graphs
Menu
Primary menu
Top
General
Upload Diagram
Sign
Business
Economy
Sizes
Anatomy
Health
Workout
Food
Stress
Cancer
IT
Science
Energy
Women & Men
Clothes
Military
Tools
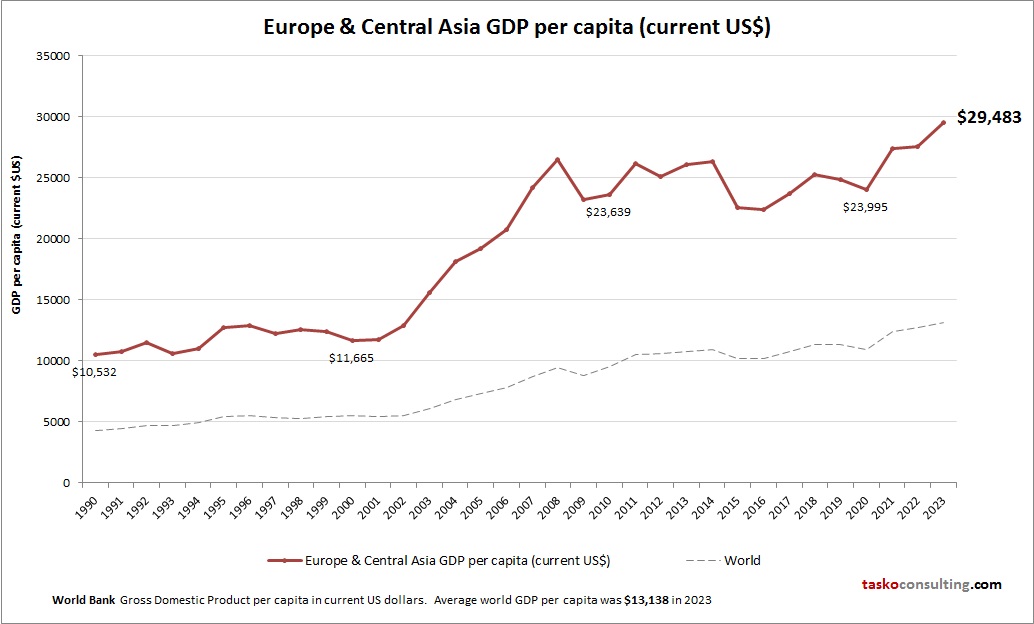
Europe Central Asia GDP per capita
Posted on
April 3, 2026
by
chartdiagram
Post navigation
←
Previous
Previous post:
Project schedule network diagram
Scroll Up