
Skip to content
cropped cropped chart diagram1 2.png

Charts | Diagrams | Graphs

Charts | Diagrams | Graphs

Menu

Primary menu

  • Top
  • General
    • Upload Diagram
    • Sign
  • Business
  • Economy
  • Sizes
  • Anatomy
  • Health
    • Workout
    • Food
    • Stress
    • Cancer
  • IT
  • Science
    • Energy
  • Women & Men
    • Clothes
    • Military
    • Tools

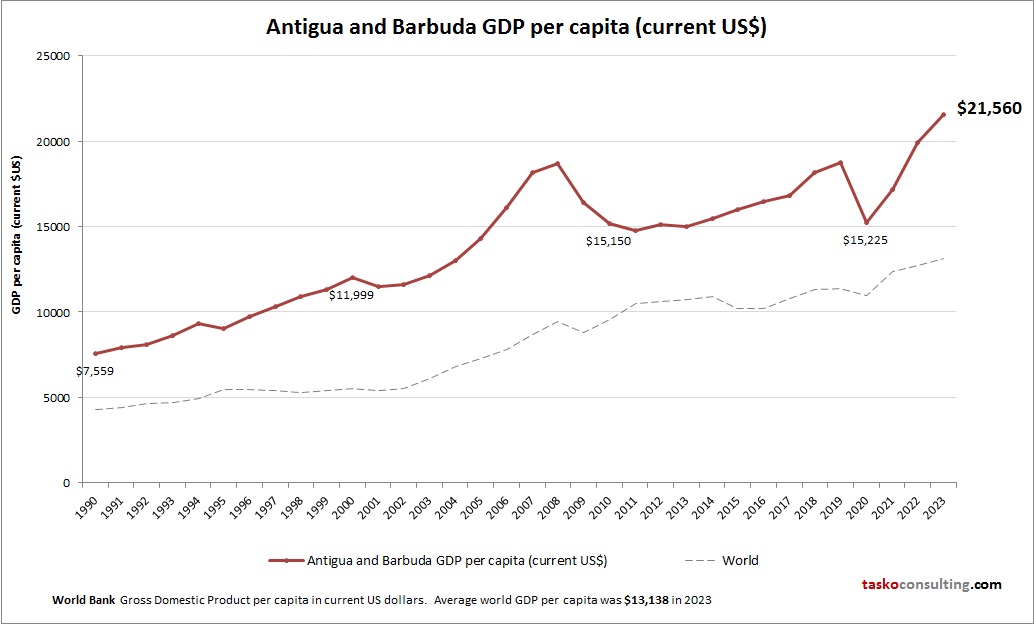
Antigua and Barbuda GDP per capita

Posted on January 6, 2026 by chartdiagram
Antigua and Barbuda GDP per capita

This chart demonstrates Antigua and Barbuda GDP per capita. World Bank is the source of this economic data. Based on the latest economic info provided for Antigua and Barbuda.

Tags: Antigua and Barbuda data, Antigua and Barbuda economy, Antigua and Barbuda GDP per person, Antigua and Barbuda gross domestic product per capita, Antigua and Barbuda statistics
This entry was posted in Economy and tagged Antigua and Barbuda data, Antigua and Barbuda economy, Antigua and Barbuda GDP per person, Antigua and Barbuda gross domestic product per capita, Antigua and Barbuda statistics by chartdiagram. Bookmark the permalink.

Post navigation

← Previous Previous post: Agile scrum methodology in software development
Next → Next post: Ecuador GDP per capita

Primary Sidebar Widget Area

Top Diagrams

  • Cell Structure Cell Structure
  • Keto Breakfast Lunch Dinner Keto Breakfast Lunch Dinner
  • cardiovascular system Cardiovascular System
  • World Economy Gdp Comparison World Economy Gdp Comparison
  • Chemical Compound Diagram Chemical Compound Diagram
  • obesity chart Obesity Chart
  • capsule size and weight chart Capsule size and weight chart
  • Child Development – Baby Development Chart
  • Types Of Economic Cycles Types Of Economic Cycles
  • Women ski size chart Women ski size chart
  • water pipe fittings with names Water pipe fittings with names
  • Architecture History Timeline 34 Architecture History Diagram
  • fracking diagram Fracking Diagram
  • Alfred Barr Flowing Tree Of Modern Art Alfred Barr Flowing Tree Of Modern Art
  • Wine Types Explained Wine Types Explained
  • Circular Flow Of Income Model Circular Flow Of Income Model
  • Color symbolism chart Color symbolism chart
  • Hormone Balancing Food Chart Hormone Balancing Food Chart
  • Compound Microscope Diagram Compound Microscope Diagram
  • World 10 biggest cities World 10 biggest cities

Latest Posts

  • Reflection And Refraction Of Light
  • Agile tools and techniques project resources
  • Increase Business Growth
  • Biopolymer
  • 6 Sigma Dmaic Communication
  • Sales And Marketing Organization Chart Visual
  • Business Strategy Framework Template Illustrated
  • Andon
  • Project timeline diagram
  • Computer Science Diagram Example Of
  • Agricultural Systems
  • Critical change management models to evolve and survive process
  • Sales Diagram Described In Detail
  • Inventory Management Diagram
  • What Makes an Effective Leader

Top 20 Tags

  • size (30)
  • cloud computing diagram (7)
  • food (7)
  • food chart (7)
  • food diagram (7)
  • skin (6)
  • cities (6)
  • world (6)
  • population (6)
  • conversion (6)
  • strategic planning tool (6)
  • cancer (5)
  • alcohol diagram (5)
  • business strategy diagram (5)
  • process improvement diagram (5)
  • business model canvas (5)
  • sales process diagram (5)
  • strategic planning diagram (5)
  • agile project management (5)
  • leadership skills diagram (5)

Category

  • Anatomy
  • Business
  • Cancer
  • Clothes
  • Economy
  • Energy
  • Food
  • General
  • Health
  • IT
  • Military
  • Science
  • Sign
  • Sizes
  • Stress
  • Tools
  • Top
  • Women & Men
  • Workout
Copyright © 2026 Charts | Diagrams | Graphs. All Rights Reserved.
Theme: Catch Box by Catch Themes
Scroll Up