Skip to content
cropped cropped chart diagram1 2.png

Charts | Diagrams | Graphs

Charts | Diagrams | Graphs

Menu

Primary menu

  • Top
  • General
    • Upload Diagram
    • Sign
  • Business
  • Economy
  • Sizes
  • Anatomy
  • Health
    • Workout
    • Food
    • Stress
    • Cancer
  • IT
  • Science
    • Energy
  • Women & Men
    • Clothes
    • Military
    • Tools

Tag Archives: Antigua and Barbuda statistics

Antigua and Barbuda GDP per capita

Posted on January 6, 2026 by chartdiagram
Antigua and Barbuda GDP per capita

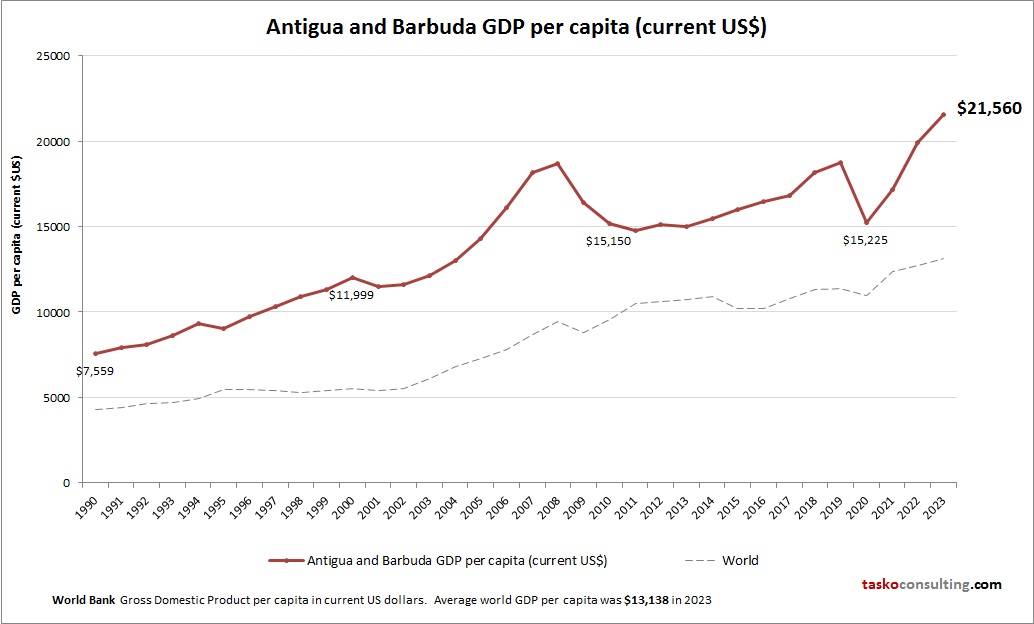
This chart demonstrates Antigua and Barbuda GDP per capita. World Bank is the source of this economic data. Based on the latest economic info provided for Antigua and Barbuda.

Posted in Economy | Tagged Antigua and Barbuda data, Antigua and Barbuda economy, Antigua and Barbuda GDP per person, Antigua and Barbuda gross domestic product per capita, Antigua and Barbuda statistics

Primary Sidebar Widget Area

Top Diagrams

  • Women's Clothing Size Chart Women’s Clothing Size Chart

  • Political Compass Chart Political Compass Chart

  • Modern suit fit explained Modern suit fit explained

  • piano chord chart Piano Chord Chart

  • Model Governance Framework Model Governance Framework

  • current state vs. future state Current state vs. future state

  • conceptual framework accounting Conceptual Framework Accounting

  • Flowchart of project implementation Flowchart of Project Implementation

  • Competency Framework Competency Framework

  • Biology Diagrams Example Of Biology Diagrams Example Of

  • Small states GDP per capita Small states GDP per capita

  • Planning Cycle In Early Childhood Education Planning Cycle In Early Childhood Education

  • Mens boxer briefs size chart Mens boxer briefs size chart

  • What is agile a comprehensive guide What is agile a comprehensive guide

  • How Stress Affects Human Body How Stress Affects Human Body

  • Physics Formulas Physics Formulas

  • Design Tech Intl Wiring Diagram Design Tech Intl Wiring Diagram

  • Post demographic dividend GDP per capita Post demographic dividend GDP per capita

  • What does agile mean in software development What does agile mean in software development

  • The visual mind why diagrams work The Visual Mind

Latest Posts

  • Marketing
  • Farming Illustration Diagram
  • Model Governance Framework
  • Flowchart of Project Implementation
  • Post demographic dividend GDP per capita
  • Amazon Web Services
  • Chemical Elements
  • 1998 Drucker School of Management Org Chart
  • Design Tech Intl Wiring Diagram
  • What does agile mean in software development
  • Competency Framework
  • Business Model Template
  • The Visual Mind
  • What is agile a comprehensive guide
  • Planning Cycle In Early Childhood Education

Top 20 Tags

  • size (30)
  • food (7)
  • food chart (7)
  • food diagram (7)
  • skin (6)
  • cities (6)
  • world (6)
  • population (6)
  • conversion (6)
  • cancer (5)
  • alcohol diagram (5)
  • sales process diagram (5)
  • car diagram (4)
  • water cycle (4)
  • stress (4)
  • how stress affects body (4)
  • yoga (4)
  • yoga poses (4)
  • yoga workout (4)
  • best yoga (4)

Category

  • Anatomy
  • Business
  • Cancer
  • Clothes
  • Economy
  • Energy
  • Food
  • General
  • Health
  • IT
  • Military
  • Science
  • Sign
  • Sizes
  • Stress
  • Tools
  • Top
  • Women & Men
  • Workout
Copyright © 2026 Charts | Diagrams | Graphs. All Rights Reserved.
Theme: Catch Box by Catch Themes
Scroll Up