Skip to content
cropped cropped chart diagram1 2.png

Charts | Diagrams | Graphs

Charts | Diagrams | Graphs

Menu

Primary menu

  • Top
  • General
    • Upload Diagram
    • Sign
  • Business
  • Economy
  • Sizes
  • Anatomy
  • Health
    • Workout
    • Food
    • Stress
    • Cancer
  • IT
  • Science
    • Energy
  • Women & Men
    • Clothes
    • Military
    • Tools

Mauritius GDP per capita

Posted on November 9, 2025 by chartdiagram
Mauritius GDP per capita

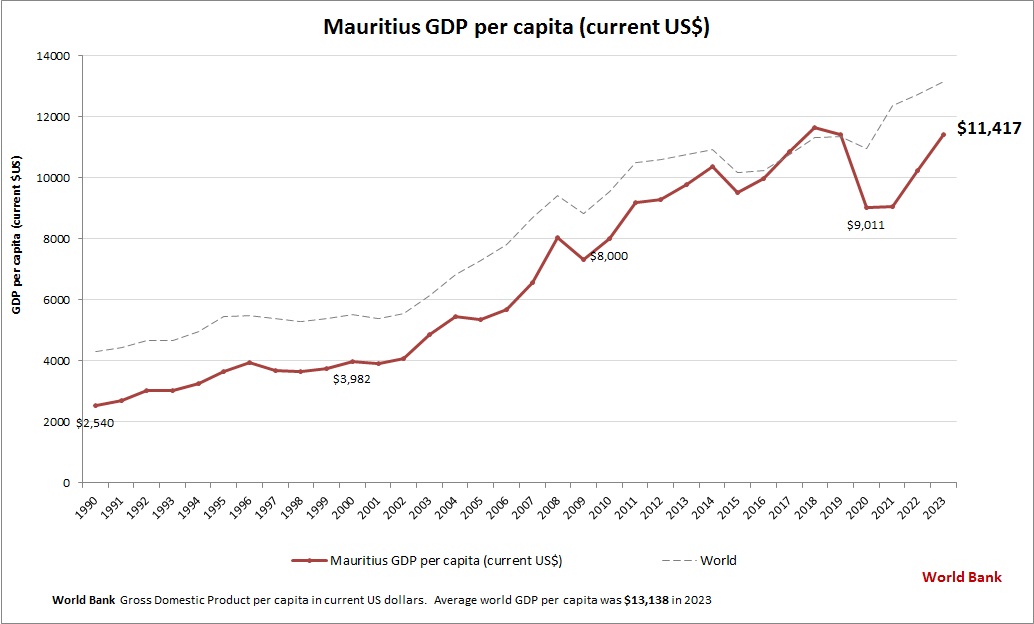
This graph shows Mauritius GDP per capita. World Bank is the source of this economic data. Latest GDP per person information for Mauritius.

Tags: Mauritius data, Mauritius economy, Mauritius GDP per person, Mauritius gross domestic product per capita, Mauritius statistics
This entry was posted in Economy and tagged Mauritius data, Mauritius economy, Mauritius GDP per person, Mauritius gross domestic product per capita, Mauritius statistics by chartdiagram. Bookmark the permalink.

Post navigation

← Previous Previous post: Integrated Transformation
Next → Next post: Services value chain analysis management industry framework

Primary Sidebar Widget Area

Top Diagrams

  • Leader followers goals Leader Followers Goals

  • obesity chart Obesity Chart

  • North Macedonia GDP per capita North Macedonia GDP per capita

  • Political Compass Chart Political Compass Chart

  • shoe size chart Shoe Size Chart

  • Seychelles GDP per capita Seychelles GDP per capita

  • Market intelligence analysis marketing strategy Market intelligence analysis marketing strategy

  • Nauru GDP per capita Nauru GDP per capita

  • Atom Diagram

  • Business strategy frameworks Business Strategy Frameworks

  • Computer Science Diagram 76 Computer Science Flow Diagram

  • Framework Analysis Framework Analysis

  • Cash flow chart Cash Flow Chart

  • Stanford Design Thinking Process Stanford Design Thinking Process

  • Strategic partnership development Strategic Partnership Development

  • Agile and model based design for engineering software development Agile and model based design for engineering software development

  • Renaissance Art History Timeline Renaissance Art History Timeline

  • Plant cell explained Plant cell explained

  • Economic Systems Of The Future Economic Systems Of The Future

  • Agile scrum an overview on process and planning Agile scrum an overview on process and planning

Latest Posts

  • Conceptual Physics Drawings
  • Business Strategy Frameworks
  • Employee Engagement Surveys The Right Group
  • Physics Formulas
  • Agile and model based design for engineering software development
  • Leader Followers Goals
  • Agile scrum an overview on process and planning
  • Economic Systems Of The Future
  • Framework Analysis
  • North Macedonia GDP per capita
  • Cash Flow Chart
  • Technology vs Humanity Venn Diagram
  • Plant cell explained
  • Nauru GDP per capita
  • Strategic Partnership Development

Top 20 Tags

  • size (30)
  • food (7)
  • food chart (7)
  • food diagram (7)
  • skin (6)
  • cities (6)
  • world (6)
  • population (6)
  • conversion (6)
  • cancer (5)
  • alcohol diagram (5)
  • sales process diagram (5)
  • car diagram (4)
  • water cycle (4)
  • stress (4)
  • how stress affects body (4)
  • yoga (4)
  • yoga poses (4)
  • yoga workout (4)
  • best yoga (4)

Category

  • Anatomy
  • Business
  • Cancer
  • Clothes
  • Economy
  • Energy
  • Food
  • General
  • Health
  • IT
  • Military
  • Science
  • Sign
  • Sizes
  • Stress
  • Tools
  • Top
  • Women & Men
  • Workout
Copyright © 2026 Charts | Diagrams | Graphs. All Rights Reserved.
Theme: Catch Box by Catch Themes
Scroll Up