Skip to content
cropped cropped chart diagram1 2.png

Charts | Diagrams | Graphs

Charts | Diagrams | Graphs

Menu

Primary menu

  • Top
  • General
    • Upload Diagram
    • Sign
  • Business
  • Economy
  • Sizes
  • Anatomy
  • Health
    • Workout
    • Food
    • Stress
    • Cancer
  • IT
  • Science
    • Energy
  • Women & Men
    • Clothes
    • Military
    • Tools

Tag Archives: Arab World statistics

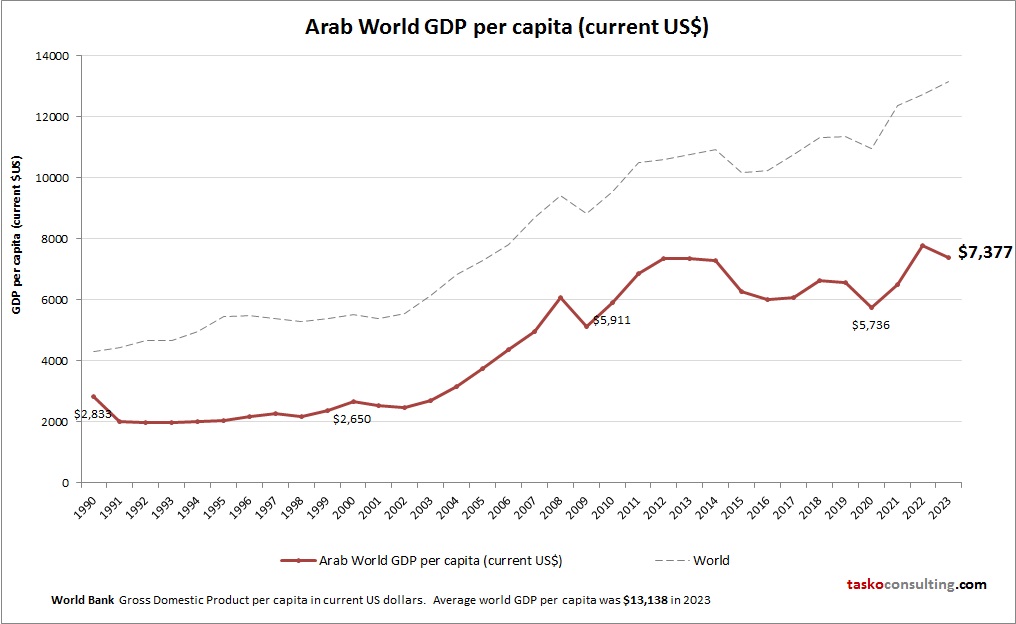
Arab World GDP per capita
Posted on May 5, 2026 by chartdiagram
Arab World GDP per capita

This chart demonstrates Arab World GDP per capita. World Bank is the source of this economic data. Based on the latest available information for Arab World.

Posted in Economy | Tagged Arab World data, Arab World economy, Arab World GDP per person, Arab World gross domestic product per capita, Arab World statistics

Primary Sidebar Widget Area

Top Diagrams

  • Agile model of software development the development cycle Agile Model of Software Development the Development Cycle
  • cardiovascular system Cardiovascular System
  • liver diagram Liver Diagram
  • Cloud Computing Architecture Cloud Computing Architecture
  • piano chord chart Piano Chord Chart
  • Australia GDP per capita Australia GDP per capita
  • obesity chart Obesity Chart
  • Situational leadership model Situational Leadership Model
  • current state vs. future state Current state vs. future state
  • Switzerland GDP per capita Switzerland GDP per capita
  • Ai Strategy Framework Illustrated Ai Strategy Framework Illustrated
  • Moldova GDP per capita Moldova GDP per capita
  • Fruits Chart with names Fruits Chart with names
  • Digestive System Diagram
  • Policy Agenda Policy Agenda
  • circulatory system Circulatory System
  • T-S Diagram
  • An Implementation Of A Strategy An Implementation Of A Strategy
  • Marketing Sales Funnel Described in detail Marketing Sales Funnel Described In Detail
  • capsule size and weight chart Capsule size and weight chart

Latest Posts

  • North America GDP per capita
  • Moldova GDP per capita
  • Cloud Computing Architecture
  • An Implementation Of A Strategy
  • Investment Pyramid Managing Risk
  • Ireland GDP per capita
  • Australia GDP per capita
  • Marketing Sales Funnel Described In Detail
  • Corporate Governance Best Practices
  • Business Performance Improvement
  • How Banks Make Money
  • Strategic Management Framework Diagram
  • Innovation Bell Curve
  • Absent On The Finger Screen Machine
  • Cloud Computing Diagram

Top 20 Tags

  • size (30)
  • cloud computing diagram (7)
  • food (7)
  • food chart (7)
  • food diagram (7)
  • skin (6)
  • cities (6)
  • world (6)
  • population (6)
  • conversion (6)
  • strategic planning tool (6)
  • cancer (5)
  • alcohol diagram (5)
  • business strategy diagram (5)
  • business model canvas (5)
  • sales process diagram (5)
  • strategic planning diagram (5)
  • agile project management (5)
  • leadership skills diagram (5)
  • car diagram (4)

Category

  • Anatomy
  • Business
  • Cancer
  • Clothes
  • Economy
  • Energy
  • Food
  • General
  • Health
  • IT
  • Military
  • Science
  • Sign
  • Sizes
  • Stress
  • Tools
  • Top
  • Women & Men
  • Workout
Copyright © 2026 Charts | Diagrams | Graphs. All Rights Reserved.
Theme: Catch Box by Catch Themes
Scroll Up