
Skip to content
cropped cropped chart diagram1 2.png

Charts | Diagrams | Graphs

Charts | Diagrams | Graphs

Menu

Primary menu

  • Top
  • General
    • Upload Diagram
    • Sign
  • Business
  • Economy
  • Sizes
  • Anatomy
  • Health
    • Workout
    • Food
    • Stress
    • Cancer
  • IT
  • Science
    • Energy
  • Women & Men
    • Clothes
    • Military
    • Tools

Tag Archives: block graphs

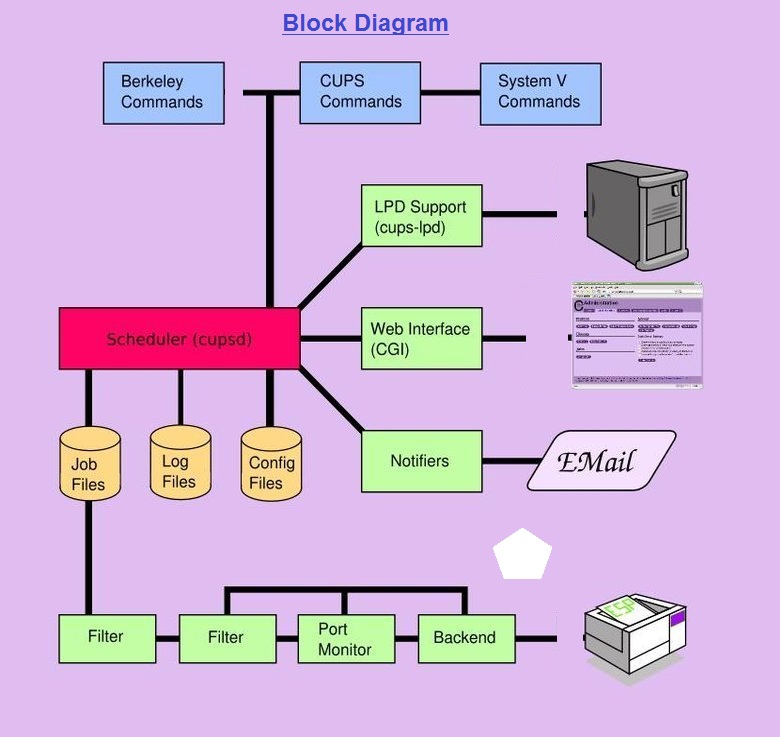
Block Diagram

Posted on February 5, 2022 by chartdiagram
block diagram

Block Chart – Block Diagram – Block Graph – Block charts, block diagrams and block plots are examples of Block graphs. This type of diagram depicts system components in blocks chunks. Additionally, see state diagram. block diagrams

Posted in IT | Tagged block, block chart, block charts, block diagram, block diagrams, block graph, block graphic, block graphs, block image, block infographic, block plot, block table

Primary Sidebar Widget Area

Top Diagrams

  • cardiovascular system Cardiovascular System
  • Agile model of software development the development cycle Agile Model of Software Development the Development Cycle
  • muscular system diagram Muscular System Diagram
  • North Korea GDP per capita North Korea GDP per capita
  • Pestle analysis cycle PESTLE Analysis Cycle
  • Integrated AI strategy Integrated AI Strategy
  • Marketing Sales Funnel Marketing Sales Funnel
  • Health Venn Diagram Described Health Venn Diagram Described
  • liver diagram Liver Diagram
  • Newton's Second Law Of Motion Newton’s Second Law Of Motion
  • Competency based hr management ppt slides Competency-Based HR Management PPT Slides
  • Cloud Service Models Representation Cloud Service Models Representation
  • Liechtenstein GDP per capita Liechtenstein GDP per capita
  • How to Study Effectively How to Study Effectively
  • Investment Strategy Investment Strategy
  • Guitar Chord Chart
  • Ukraine GDP per capita Ukraine GDP per capita
  • Color combinations for clothes Color combinations for clothes
  • Agile tools and techniques project resources Agile tools and techniques project resources
  • Physics Formulas Physics Formulas

Latest Posts

  • BDR AE Sales Flowchart
  • Integrated AI Strategy
  • PESTLE Analysis Cycle
  • Increase Business
  • Lithuania GDP per capita
  • Reflection And Refraction Of Light
  • Agile tools and techniques project resources
  • Increase Business Growth
  • Biopolymer
  • 6 Sigma Dmaic Communication
  • Sales And Marketing Organization Chart Visual
  • Business Strategy Framework Template Illustrated
  • Andon
  • Project timeline diagram
  • Computer Science Diagram Example Of

Top 20 Tags

  • size (30)
  • cloud computing diagram (7)
  • food (7)
  • food chart (7)
  • food diagram (7)
  • skin (6)
  • cities (6)
  • world (6)
  • population (6)
  • conversion (6)
  • strategic planning tool (6)
  • cancer (5)
  • alcohol diagram (5)
  • business strategy diagram (5)
  • process improvement diagram (5)
  • business model canvas (5)
  • sales process diagram (5)
  • strategic planning diagram (5)
  • agile project management (5)
  • leadership skills diagram (5)

Category

  • Anatomy
  • Business
  • Cancer
  • Clothes
  • Economy
  • Energy
  • Food
  • General
  • Health
  • IT
  • Military
  • Science
  • Sign
  • Sizes
  • Stress
  • Tools
  • Top
  • Women & Men
  • Workout
Copyright © 2026 Charts | Diagrams | Graphs. All Rights Reserved.
Theme: Catch Box by Catch Themes
Scroll Up