Skip to content
cropped cropped chart diagram1 2.png

Charts | Diagrams | Graphs

Charts | Diagrams | Graphs

Menu

Primary menu

  • Top
  • General
    • Upload Diagram
    • Sign
  • Business
  • Economy
  • Sizes
  • Anatomy
  • Health
    • Workout
    • Food
    • Stress
    • Cancer
  • IT
  • Science
    • Energy
  • Women & Men
    • Clothes
    • Military
    • Tools

Tag Archives: risk management security framework

Security Triangle

Posted on February 10, 2026 by chartdiagram
Security triangle people process technology

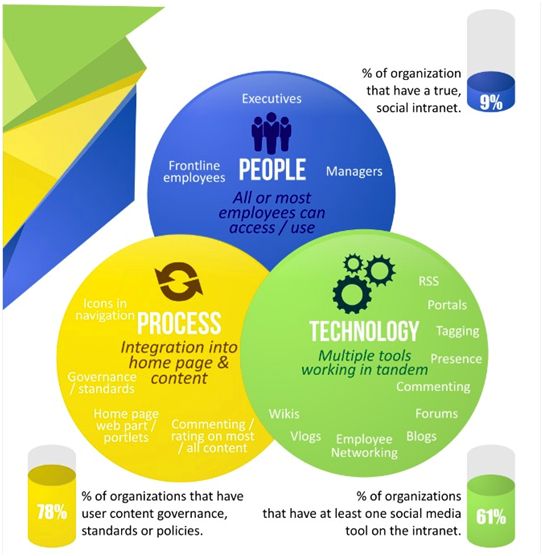
Security Triangle: People, Process, Technology: This model emphasizes the balance needed between people, processes, and technology for effective security management. Each element must support the others to minimize risks and protect organizational assets.

Posted in Business | Tagged cybersecurity triangle, data protection diagram, information security model, risk management security framework, security risk triangle

Primary Sidebar Widget Area

Top Diagrams

  • Situational leadership model Situational Leadership Model

  • Bond Line Structure Bond Line Structure

  • How Stress Affects Body How Stress Affects Body

  • Bra Sizes – Bra Chart

  • Dress shoes types Dress shoes types

  • World Gdpworld Economy Gdp World Economy Gdp

  • Historical Fiction Vs Contemporary Realistic Venn Diagram Historical Fiction Vs Contemporary Realistic Venn Diagram

  • Women's Clothing Size Chart Women’s Clothing Size Chart

  • capsule size and weight chart Capsule size and weight chart

  • Singapore GDP per capita Singapore GDP per capita

  • Agile and model based design for engineering software development Agile and model based design for engineering software development

  • Solar Panel Electricity Explained Solar Panel Electricity Explained

  • muscular system diagram Muscular System Diagram

  • How Technology Works Blockchain How Technology Works Blockchain

  • engine diagram Engine Diagram

  • value stream map Value Stream Map

  • Maslow’s Hierarchy of Needs

  • Top countries by population 1 Top countries by population

  • Wellness

  • Regenerative Agriculture 25 Regenerative Agriculture Explained

Latest Posts

  • Singapore GDP per capita
  • Bond Line Structure
  • Demographic Diagram Explained
  • Agile Development in Practice
  • Venn Diagram Design
  • Manufacturing Process Design
  • Simple Business Canvas
  • Customer Satisfaction Survey Results
  • Mastering Business Analysis
  • Business Analysis Best Practice Tools Techniques Methods
  • Data Science Venn Diagram Model
  • People Management Replacing Talent Management
  • What is scrum the agile journey
  • How farming works
  • Business analysis poster

Top 20 Tags

  • size (30)
  • food (7)
  • food chart (7)
  • food diagram (7)
  • skin (6)
  • cities (6)
  • world (6)
  • population (6)
  • conversion (6)
  • cancer (5)
  • alcohol diagram (5)
  • sales process diagram (5)
  • car diagram (4)
  • water cycle (4)
  • stress (4)
  • how stress affects body (4)
  • yoga (4)
  • yoga poses (4)
  • yoga workout (4)
  • best yoga (4)

Category

  • Anatomy
  • Business
  • Cancer
  • Clothes
  • Economy
  • Energy
  • Food
  • General
  • Health
  • IT
  • Military
  • Science
  • Sign
  • Sizes
  • Stress
  • Tools
  • Top
  • Women & Men
  • Workout
Copyright © 2026 Charts | Diagrams | Graphs. All Rights Reserved.
Theme: Catch Box by Catch Themes
Scroll Up