Skip to content
cropped cropped chart diagram1 2.png

Charts | Diagrams | Graphs

Charts | Diagrams | Graphs

Menu

Primary menu

  • Top
  • General
    • Upload Diagram
    • Sign
  • Business
  • Economy
  • Sizes
  • Anatomy
  • Health
    • Workout
    • Food
    • Stress
    • Cancer
  • IT
  • Science
    • Energy
  • Women & Men
    • Clothes
    • Military
    • Tools

Tag Archives: South Sudan data

South Sudan GDP per capita

Posted on August 24, 2025 by chartdiagram
South Sudan GDP per capita

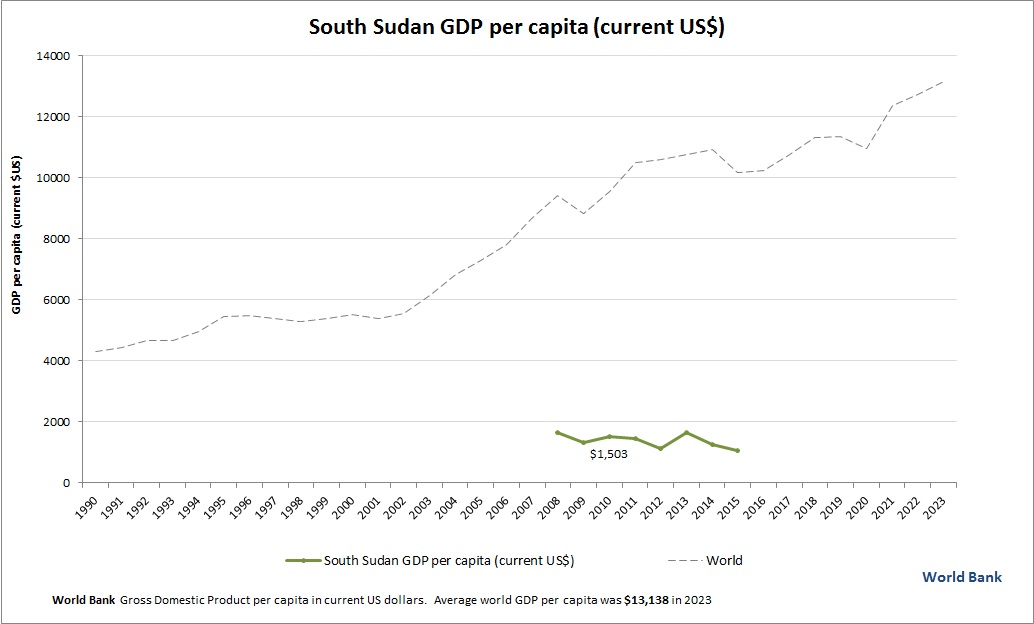
This chart demonstrates South Sudan GDP per capita. World Bank is the source of this economic data. Based on the latest economic info provided for South Sudan.

Posted in Economy | Tagged South Sudan data, South Sudan economy, South Sudan GDP per person, South Sudan gross domestic product per capita, South Sudan statistics

Primary Sidebar Widget Area

Top Diagrams

  • Women's Clothing Size Chart Women’s Clothing Size Chart

  • obesity chart Obesity Chart

  • Farming Diagramfarm Diagram 90 Farming Explained

  • Leadership structure sample Leadership structure sample

  • Business Strategic Planning Framework Diagram Business Strategic Planning Framework Diagram

  • Multi Cloud Environment with IaaS PaaS and SaaS Multi-Cloud Environment with IaaS, PaaS, and SaaS

  • Pestel analysis powerpoint template Pestel analysis powerpoint template

  • Bead size chart Bead size chart

  • Slovenia GDP per capita Slovenia GDP per capita

  • Dot And Cross Diagrams Of Ionic Bonding Dot And Cross Diagrams Of Ionic Bonding

  • Green Revolution Farming System Green Revolution Farming System

  • Types Of Agriculture 19 Types Of Agriculture Explained

  • shower diagram Shower Diagram

  • Maslow’s Hierarchy of Needs

  • Latvia GDP per capita Latvia GDP per capita

  • Physics Symbols Chart Physics Symbols Chart

  • Essential Geography Skills Essential Geography Skills

  • Political Compass Chart Political Compass Chart

  • Estrogen rich food chart Estrogen rich food chart

  • Circular Flow Model Circular Flow Model

Latest Posts

  • Pestel analysis powerpoint template
  • How agile changed software development
  • Customer Self Service
  • Senegal GDP per capita
  • Computer Science Diagram Examined
  • Business Analysis Competency Model
  • Iraq GDP per capita
  • Marketing And Sales Organization Chart
  • What is agile methodology and how can it help your online shop
  • Enterprise Architecture Blueprint Hospital
  • Scientific Diagrams Of Laboratory Apparatus
  • Increase Efficiency
  • Cute Venn Diagram
  • Policy Agenda
  • 4 Steps Business Powerpoint Strategy Diagram

Top 20 Tags

  • size (30)
  • food (7)
  • food chart (7)
  • food diagram (7)
  • skin (6)
  • cities (6)
  • world (6)
  • population (6)
  • conversion (6)
  • cancer (5)
  • alcohol diagram (5)
  • sales process diagram (5)
  • car diagram (4)
  • water cycle (4)
  • stress (4)
  • how stress affects body (4)
  • yoga (4)
  • yoga poses (4)
  • yoga workout (4)
  • best yoga (4)

Category

  • Anatomy
  • Business
  • Cancer
  • Clothes
  • Economy
  • Energy
  • Food
  • General
  • Health
  • IT
  • Military
  • Science
  • Sign
  • Sizes
  • Stress
  • Tools
  • Top
  • Women & Men
  • Workout
Copyright © 2026 Charts | Diagrams | Graphs. All Rights Reserved.
Theme: Catch Box by Catch Themes
Scroll Up