Skip to content
cropped cropped chart diagram1 2.png

Charts | Diagrams | Graphs

Charts | Diagrams | Graphs

Menu

Primary menu

  • Top
  • General
    • Upload Diagram
    • Sign
  • Business
  • Economy
  • Sizes
  • Anatomy
  • Health
    • Workout
    • Food
    • Stress
    • Cancer
  • IT
  • Science
    • Energy
  • Women & Men
    • Clothes
    • Military
    • Tools

Caribbean small states GDP per capita

Posted on September 19, 2025 by chartdiagram
Caribbean small states GDP per capita

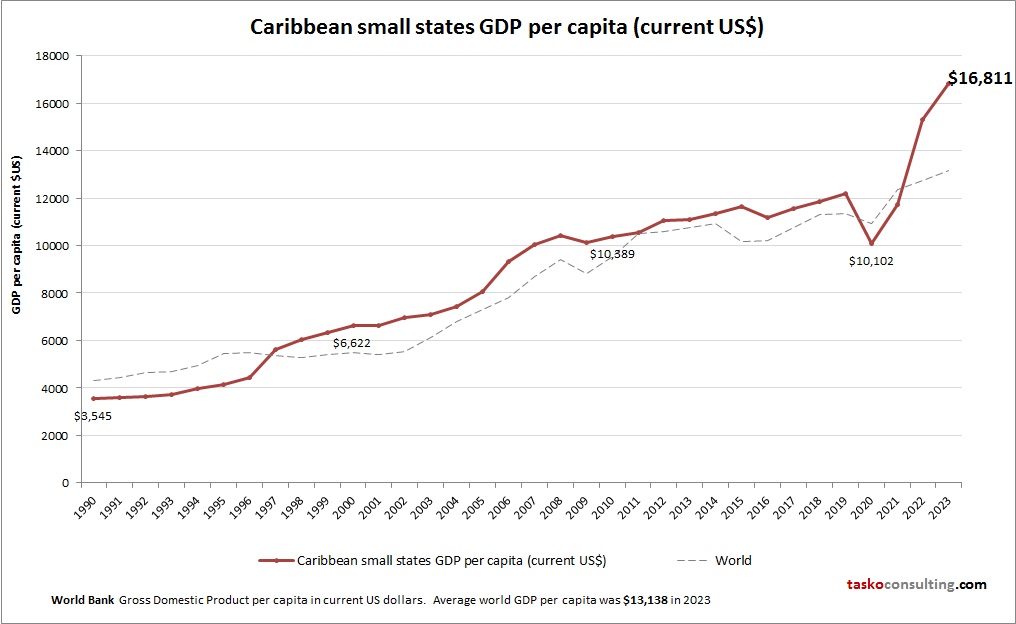
This diagram presents Caribbean small states GDP per capita. World Bank is the source of this economic data. Based on the latest available information for Caribbean small states.

Tags: Caribbean small states data, Caribbean small states economy, Caribbean small states GDP per person, Caribbean small states gross domestic product per capita, Caribbean small states statistics
This entry was posted in Economy and tagged Caribbean small states data, Caribbean small states economy, Caribbean small states GDP per person, Caribbean small states gross domestic product per capita, Caribbean small states statistics by chartdiagram. Bookmark the permalink.

Post navigation

← Previous Previous post: Bahrain GDP per capita
Next → Next post: Agile Scrum Overview

Primary Sidebar Widget Area

Top Diagrams

  • capsule size and weight chart Capsule size and weight chart

  • obesity chart Obesity Chart

  • HS strategic planning framework for health and safety legislation HS Strategic Planning Framework For Health And Safety Legislation

  • Processing Payment at a POS Processing Payment At A POS

  • shoe size chart Shoe Size Chart

  • Cloud Service Models Cloud Service Models

  • Situational leadership model powerpoint Situational leadership model powerpoint

  • Consulting change management framework Consulting Change Management Framework

  • Isle of Man GDP per capita Isle of Man GDP per capita

  • Plant Cell Diagram

  • Maslow’s Hierarchy of Needs

  • Learn agile development processes data analytics Learn Agile Development Processes

  • Scientific Test Tubes Scientific Test Tubes

  • Industry analysis framework pie chart powerpoint slide show Industry Analysis Framework Pie Chart PowerPoint Slide Show

  • Strategic Framework Sample of Strategic Framework Sample Of

  • the three major cloud service models The Three Major Cloud Service Models

  • Seychelles GDP per capita Seychelles GDP per capita

  • Agile methodology revolutionizing project management Agile methodology revolutionizing project management

  • Project roles and responsibilities Project roles and responsibilities

  • Project plan review workflow diagram Project Plan Review Workflow Diagram

Latest Posts

  • Antigua and Barbuda GDP per capita
  • Agile scrum methodology in software development
  • Project Plan Review Workflow Diagram
  • Consulting Change Management Framework
  • Seychelles GDP per capita
  • Project roles and responsibilities
  • Situational leadership model powerpoint
  • Talent Management Framework Human Resource
  • Isle of Man GDP per capita
  • Cloud Service Models
  • HS Strategic Planning Framework For Health And Safety Legislation
  • Scrum Diagram
  • Manufacturing Flow
  • Industry Analysis Framework Pie Chart PowerPoint Slide Show
  • Processing Payment At A POS

Top 20 Tags

  • size (30)
  • food (7)
  • food chart (7)
  • food diagram (7)
  • skin (6)
  • cities (6)
  • world (6)
  • population (6)
  • conversion (6)
  • cancer (5)
  • alcohol diagram (5)
  • sales process diagram (5)
  • car diagram (4)
  • water cycle (4)
  • stress (4)
  • how stress affects body (4)
  • yoga (4)
  • yoga poses (4)
  • yoga workout (4)
  • best yoga (4)

Category

  • Anatomy
  • Business
  • Cancer
  • Clothes
  • Economy
  • Energy
  • Food
  • General
  • Health
  • IT
  • Military
  • Science
  • Sign
  • Sizes
  • Stress
  • Tools
  • Top
  • Women & Men
  • Workout
Copyright © 2026 Charts | Diagrams | Graphs. All Rights Reserved.
Theme: Catch Box by Catch Themes
Scroll Up