Business Model Template Graphic

Business Model Template Graphic

Business Model Template Graphic: A business model template graphic visually represents the key components of a business model, typically using the Business Model Canvas framework. It includes sections for customer segments, value propositions, channels, customer relationships, revenue streams, key resources, key activities, key partnerships, and cost structure. This graphic helps businesses visualize and communicate their strategies in a clear and concise manner.

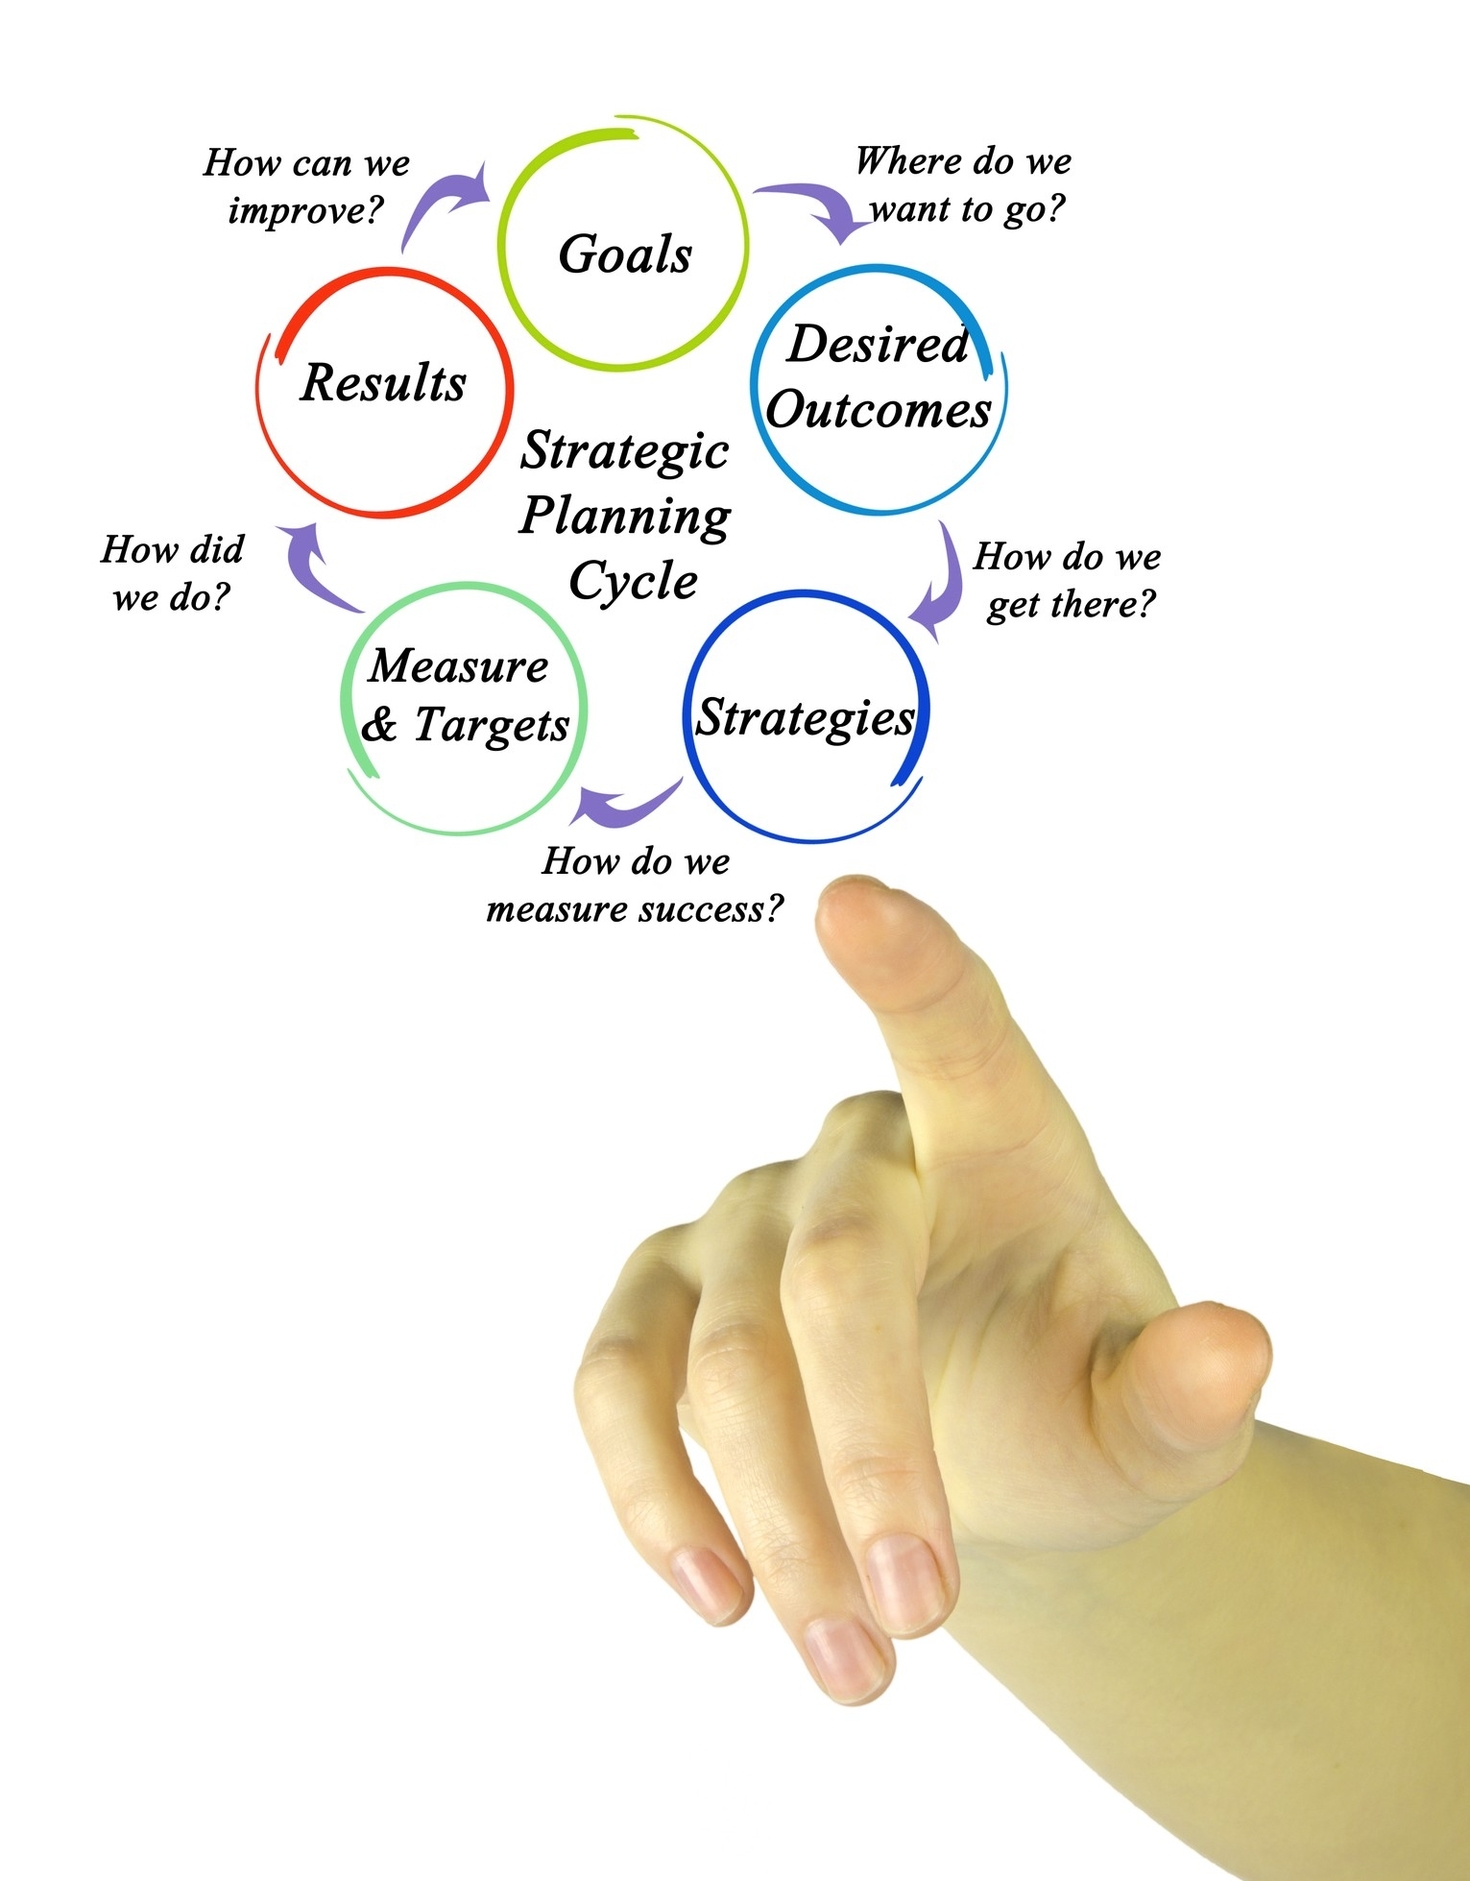
Mission Vision Goals Strategic Framework

Mission vision goals strategic framework

Mission Vision Goals Strategic Framework: This framework involves defining the organization’s mission (purpose), vision (future aspirations), and goals (specific objectives). It provides a clear direction for the organization and helps align efforts towards achieving long-term success.

Agile Software Development How-To Guide

Agile software development how to guide

Agile Software Development How-To Guide: This guide offers a practical, step-by-step approach to implementing Agile software development in real-world scenarios. It covers key concepts such as user stories, sprint planning, backlog grooming, and iterative testing. Whether you’re a developer, product owner, or project manager, this guide helps demystify the process and offers tips for building high-performing teams. Diagrams and visual workflows are used to reinforce learning and ensure that Agile Continue reading Agile Software Development How-To Guide→

Economic Logic Diagram

Economic logic diagram

Economic logic diagram: An Economic Logic Diagram visually represents the economic principles and relationships that drive a business model. It includes elements like cost structures, revenue streams, value propositions, and market dynamics. This diagram helps organizations understand the economic rationale behind their strategies and make data-driven decisions.

Process Map Symbols

Process Map Symbols

Process Map Symbols: Process map symbols are graphical representations used to illustrate different steps and decision points in a business process. These symbols include rectangles for actions, diamonds for decision points, and arrows for the flow of tasks. By using standard process map symbols, organizations can create clear, consistent visual representations of workflows that are easy to understand and analyze.

Leadership development training

Leadership development training

Leadership development training: Leadership development training equips emerging and existing leaders with the tools, frameworks, and experiences needed to lead effectively. These programs often focus on emotional intelligence, communication, strategic thinking, conflict resolution, and adaptive leadership styles, helping to create a strong pipeline of capable leaders within organizations.

Marketing Concept Diagram

Marketing Concept Diagram

Marketing Concept Diagram: The marketing concept diagram illustrates the philosophy that businesses should analyze the needs of their customers and make decisions to satisfy those needs better than the competition. It typically includes elements such as market research, target market identification, product development, pricing strategies, distribution channels, and promotional tactics.

Efficiency at Work/Working Efficiency

Efficiency At Workworking Efficiency

Efficiency at Work/Working Efficiency: Efficiency at work refers to the ability to complete tasks in the most effective and time-saving manner possible. Improving working efficiency involves time management, reducing distractions, streamlining processes, and using tools that enhance productivity. Efficient workers contribute to overall organizational performance and help achieve business goals more effectively.