

Regenerative Agriculture Diagram
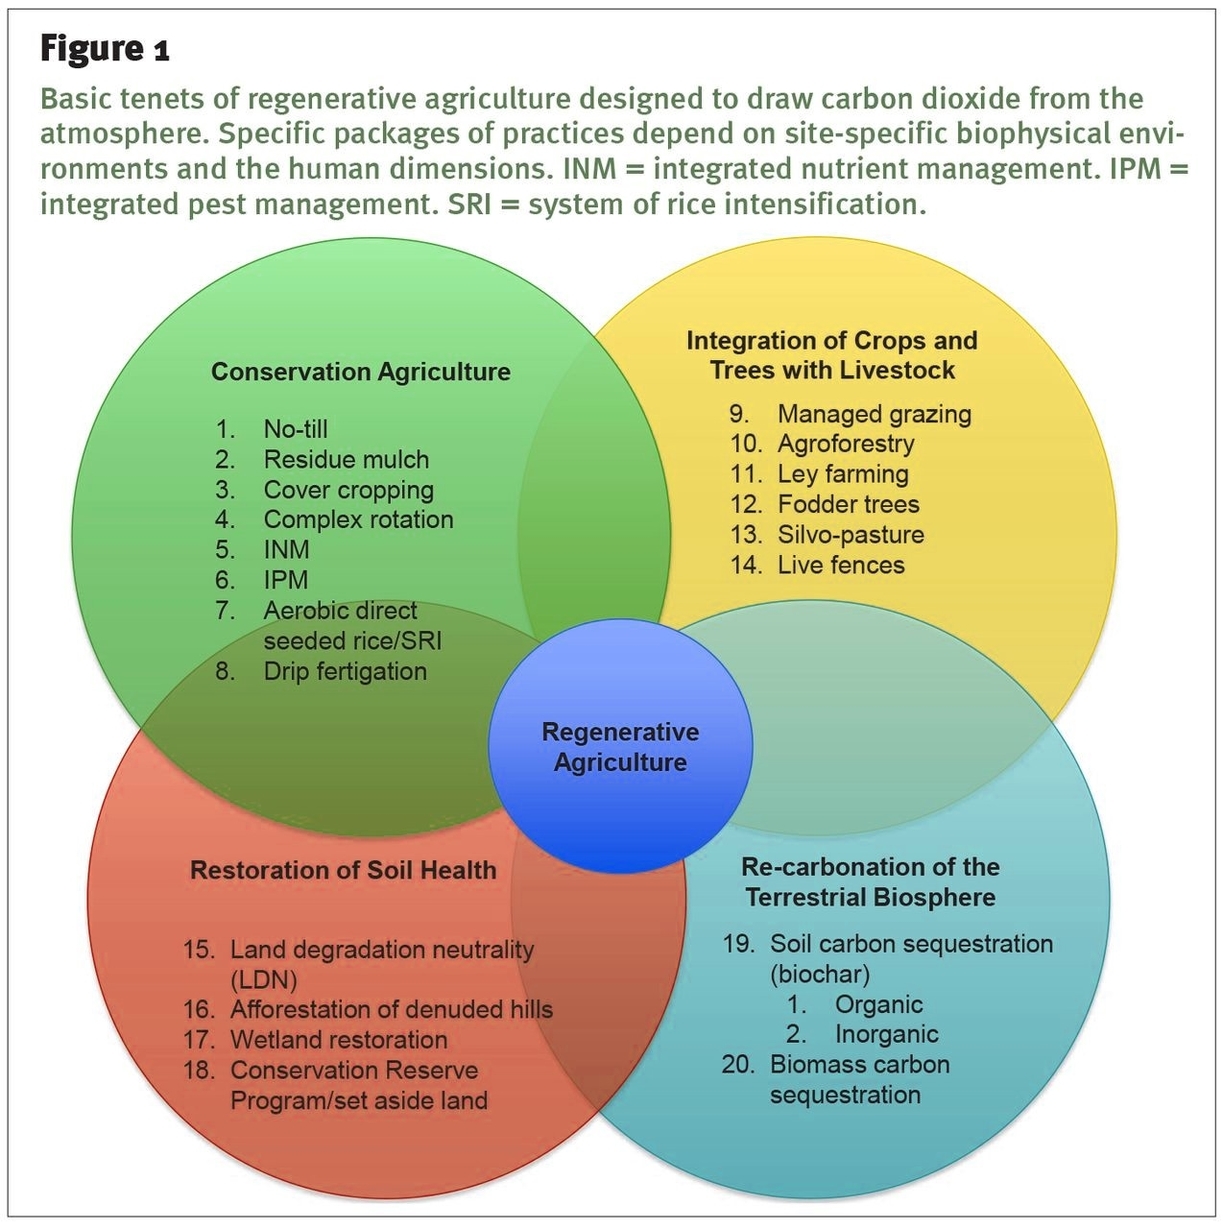
Regenerative agriculture is a farming practice that focuses on improving soil health and biodiversity. It is a holistic approach to farming that aims to create a sustainable ecosystem by regenerating the soil, reducing the use of synthetic fertilizers and pesticides, and promoting biodiversity. Regenerative agriculture is based on the principles of agroecology, which is the study of ecological processes in agricultural systems. The goal of regenerative agriculture is to create Continue reading Regenerative Agriculture Diagram