

Physics Definition, Branches And Importance
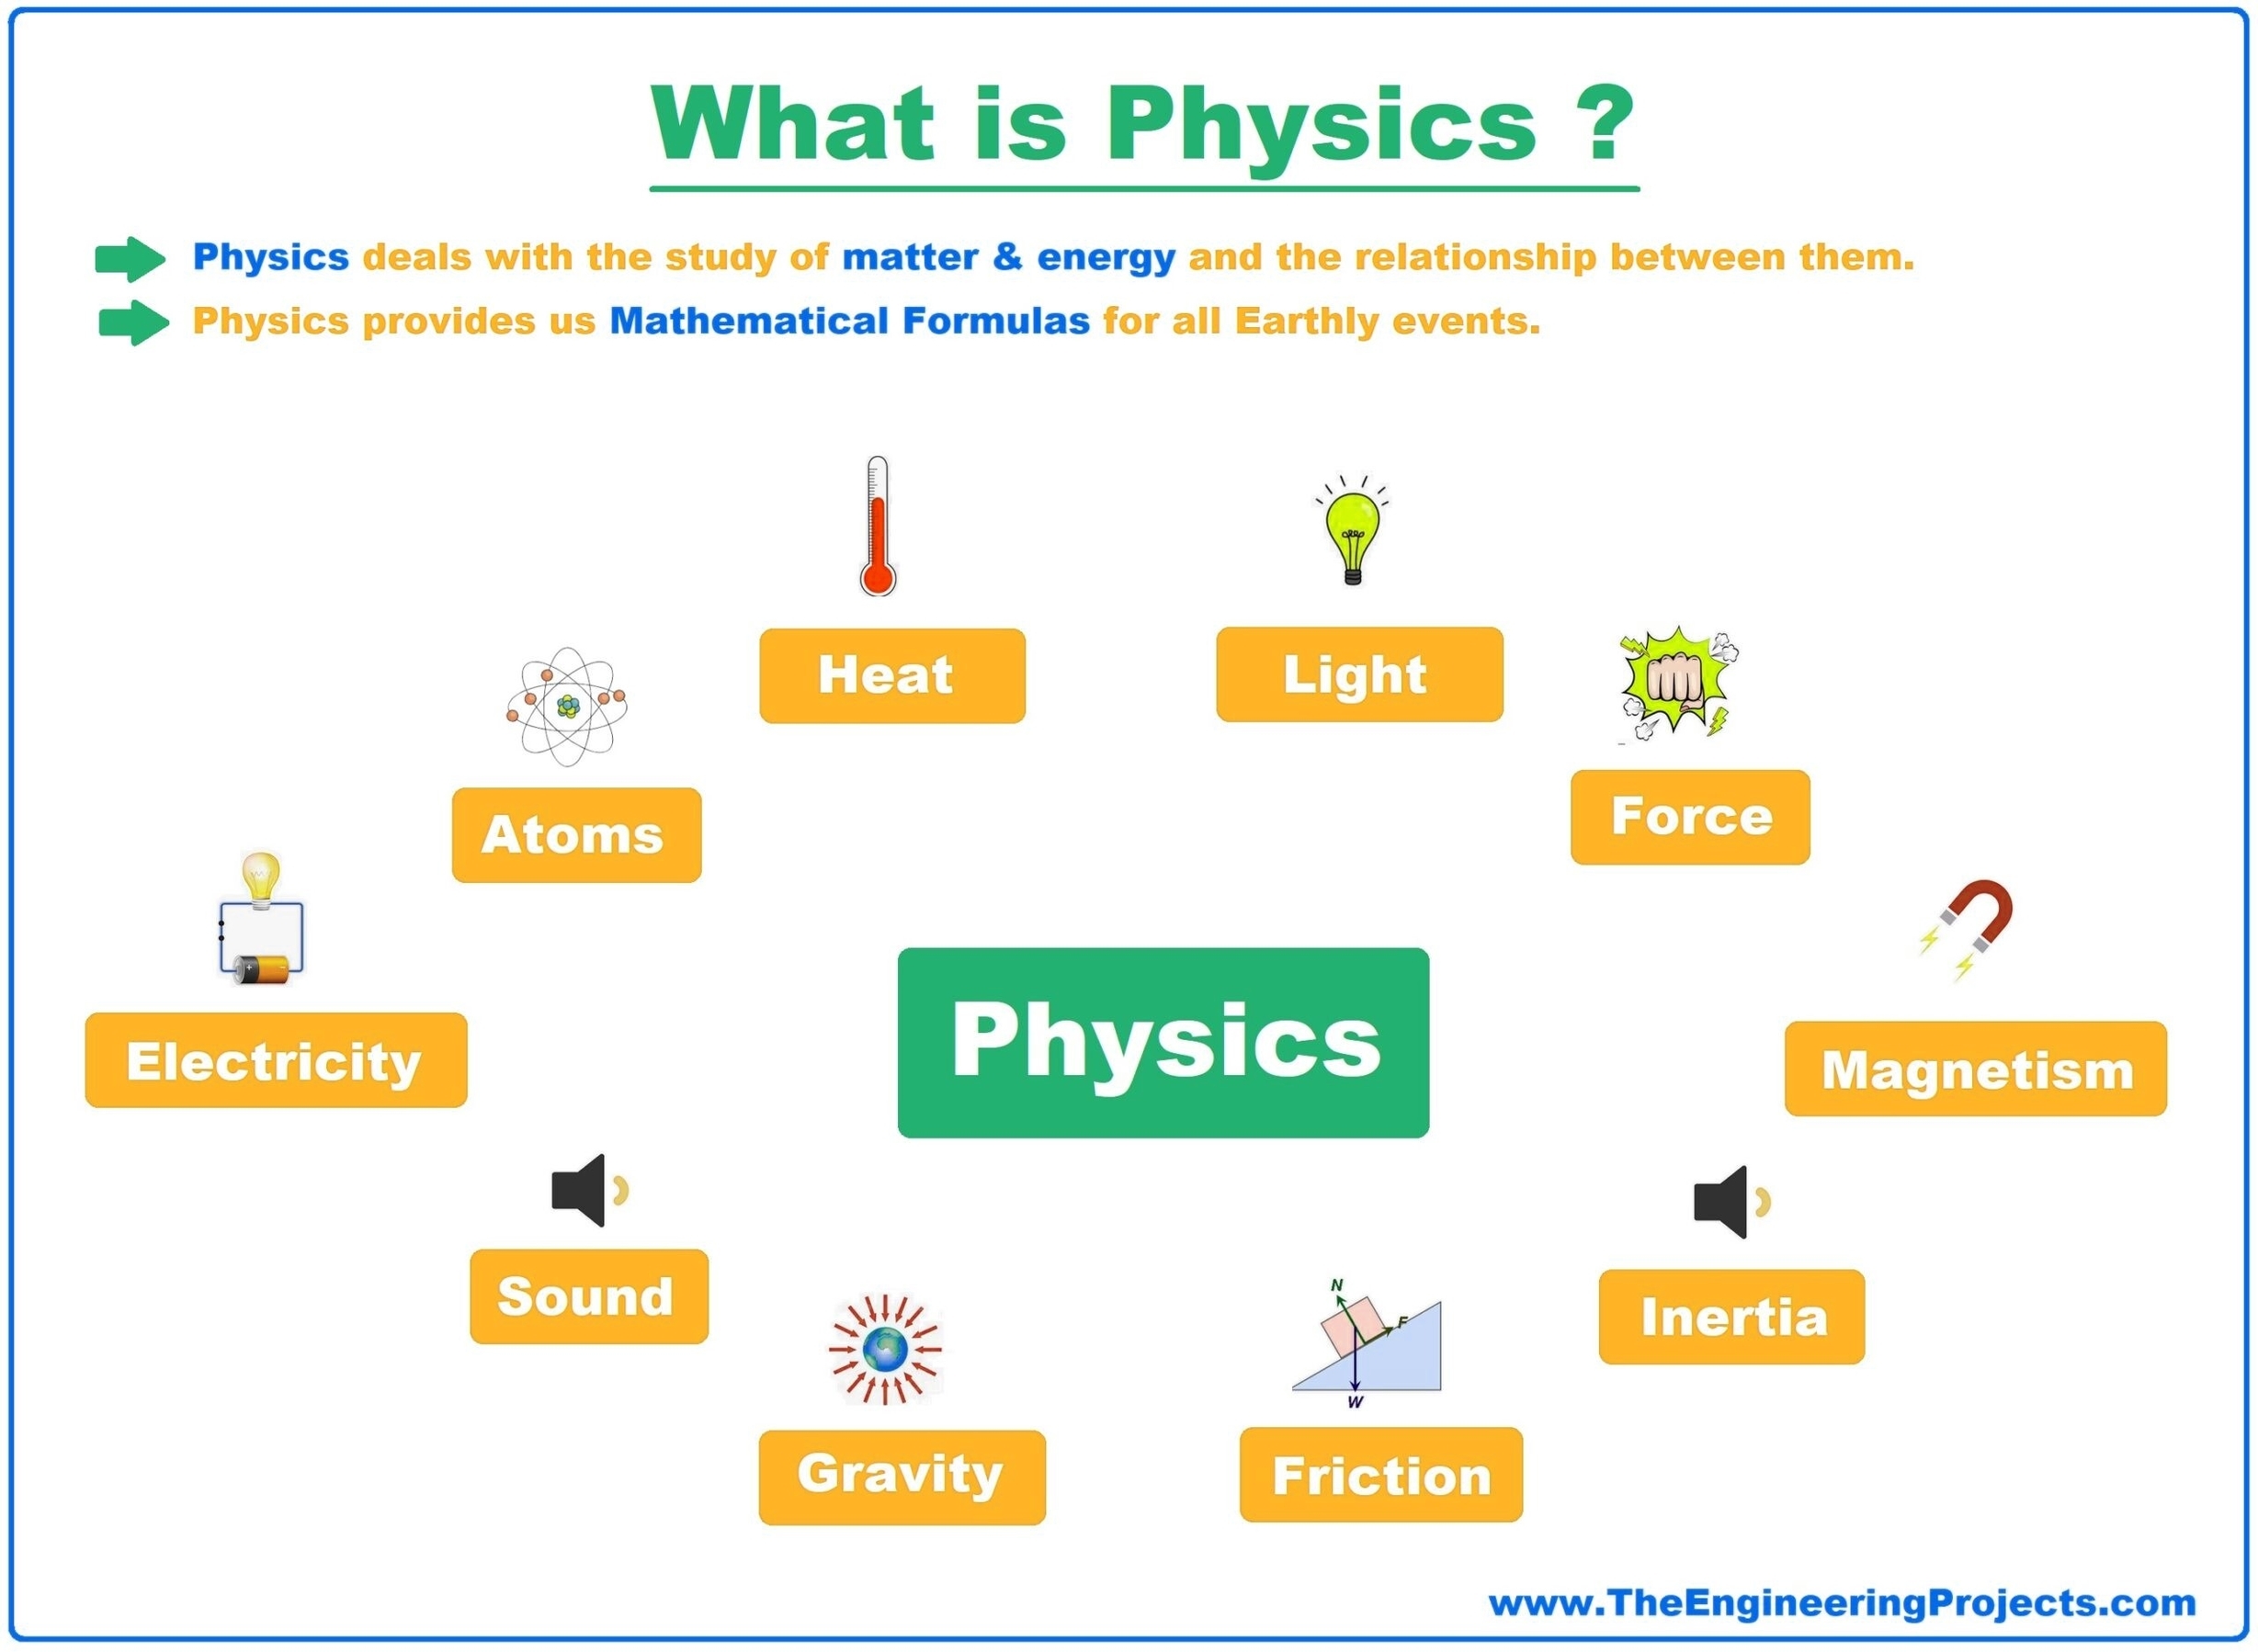
Physics Definition, Branches And Importance: Physics is the study of matter, energy, and their interactions, with branches like mechanics, thermodynamics, and electromagnetism, playing a crucial role in understanding the natural world.