
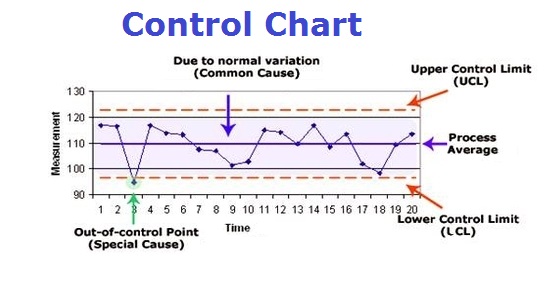

Control Chart: A control chart is a statistical tool used to monitor the stability and performance of a process over time. It plots data points on a graph with upper and lower control limits to identify variations that may indicate problems. By using control charts, organizations can ensure that processes are operating within acceptable limits and take corrective actions when necessary to maintain quality.
Tags: control chart diagram, monitoring variation chart, quality control tool, SPC visual, statistical process control