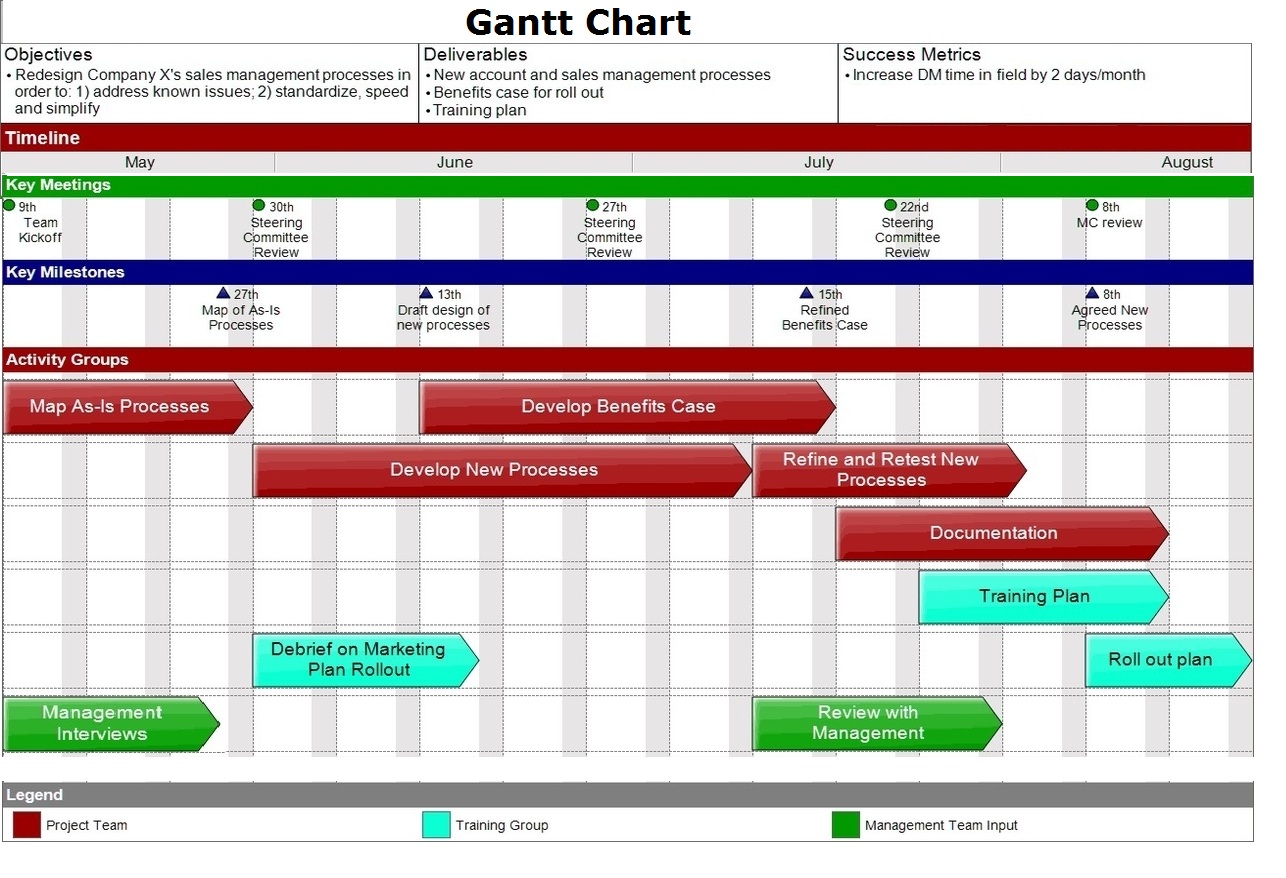
Gantt Diagram – Gantt Chart – Gantt Graph – Gantt diagram (also spelled as a gant diagram) is a chart that depicts project activities, their duration and milestones against time. Gantts charts are one the most widely used project management tools.
Charts | Diagrams | Graphs

Gantt Diagram – Gantt Chart – Gantt Graph – Gantt diagram (also spelled as a gant diagram) is a chart that depicts project activities, their duration and milestones against time. Gantts charts are one the most widely used project management tools.