Skip to content
cropped cropped chart diagram1 2.png

Charts | Diagrams | Graphs

Charts | Diagrams | Graphs

Menu

Primary menu

  • Top
  • General
    • Upload Diagram
    • Sign
  • Business
  • Economy
  • Sizes
  • Anatomy
  • Health
    • Workout
    • Food
    • Stress
    • Cancer
  • IT
  • Science
    • Energy
  • Women & Men
    • Clothes
    • Military
    • Tools

Tag Archives: gantt graphs

Gantt Diagram

Posted on February 9, 2022 by chartdiagram
gant diagram

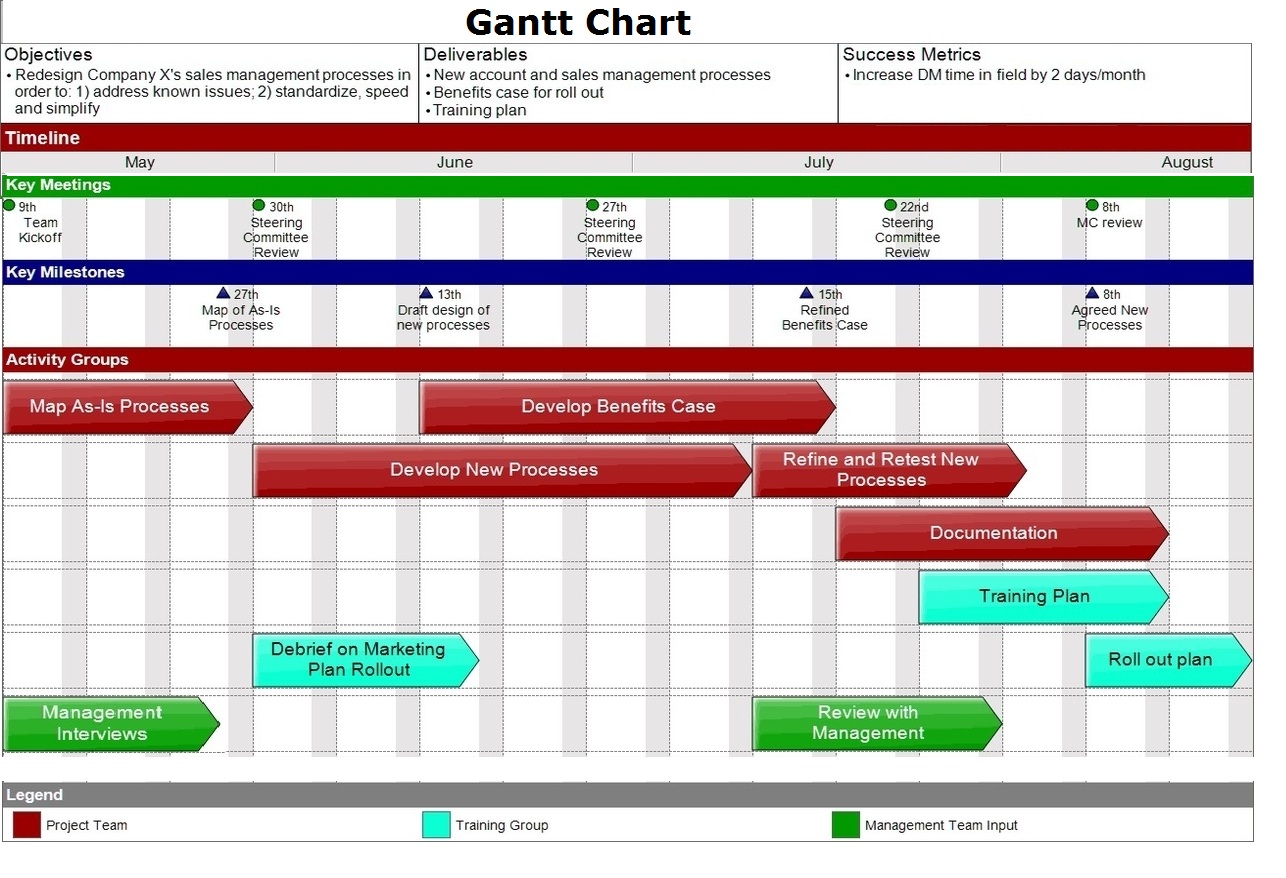
Gantt Diagram – Gantt Chart – Gantt Graph – Gantt diagram (also spelled as a gant diagram) is a chart that depicts project activities, their duration and milestones against time. Gantts charts are one the most widely used project management tools. gantt diagram

Posted in Business | Tagged gant chart, gant diagram, gant graph, gantt charts, gantt diagram, gantt explained, gantt graph, gantt graphs

Primary Sidebar Widget Area

Top Diagrams

  • capsule size and weight chart Capsule size and weight chart
  • shoe size chart Shoe Size Chart
  • Pounds to Kilograms – Kilograms to Pounds Chart
  • Microscope Diagram
  • Eye Colors
  • Geography Terms Chart Geography Terms Chart
  • Geological Time Table Geological Time Table
  • Political Compass Chart Political Compass Chart
  • Wellness
  • piano chord chart Piano Chord Chart
  • Size Cha Size Chart
  • Electrolytic Cell Electrolytic Cell
  • Free Body Diagram In Physics Free Body Diagram In Physics
  • What Is Blockchain Technology What Is Blockchain Technology
  • Biology Diagrams Example Of Biology Diagrams Example Of
  • Water Cycle Diagram Water Cycle Diagram
  • Good change management framework Good change management framework
  • Desert Mountain Clip Art Desert Mountain Clip Art
  • Convex And Concave Lenses Convex And Concave Lenses
  • Geography Landformslandform Drawings Geography Landformslandform Drawings

Latest Posts

  • Dot And Cross Diagrams Of Ionic Bonding
  • What Is Blockchain Technology
  • Modern Vector Timeline. Workflow Chart Infographic Concept for Marketing Presentation
  • Customer Service Standards
  • Top Lean Tools
  • Us Population By Age 1
  • Strategic Planning Cycle
  • Adult leadership flow chart
  • Cell Structure And Function
  • Equilibrium Of A Stationary Man
  • Djibouti GDP per capita
  • Map Of The Complexity Science
  • Japan GDP per capita
  • Multi-Cloud Environment with IaaS, PaaS, and SaaS
  • Physics Diagram Example

Top 20 Tags

  • size (30)
  • food (7)
  • food chart (7)
  • food diagram (7)
  • skin (6)
  • cities (6)
  • world (6)
  • population (6)
  • conversion (6)
  • cancer (5)
  • alcohol diagram (5)
  • car diagram (4)
  • water cycle (4)
  • stress (4)
  • how stress affects body (4)
  • yoga (4)
  • yoga poses (4)
  • yoga workout (4)
  • best yoga (4)
  • solar energy (4)

Category

  • Anatomy
  • Business
  • Cancer
  • Clothes
  • Economy
  • Energy
  • Food
  • General
  • Health
  • IT
  • Military
  • Science
  • Sign
  • Sizes
  • Stress
  • Tools
  • Top
  • Women & Men
  • Workout
Copyright © 2025 Charts | Diagrams | Graphs. All Rights Reserved.
Theme: Catch Box by Catch Themes
Scroll Up