Skip to content
cropped cropped chart diagram1 2.png

Charts | Diagrams | Graphs

Charts | Diagrams | Graphs

Menu

Primary menu

  • Top
  • General
    • Upload Diagram
    • Sign
  • Business
  • Economy
  • Sizes
  • Anatomy
  • Health
    • Workout
    • Food
    • Stress
    • Cancer
  • IT
  • Science
    • Energy
  • Women & Men
    • Clothes
    • Military
    • Tools

Republic of the Congo GDP per capita

Posted on August 14, 2025 by chartdiagram
Republic of the Congo GDP per capita

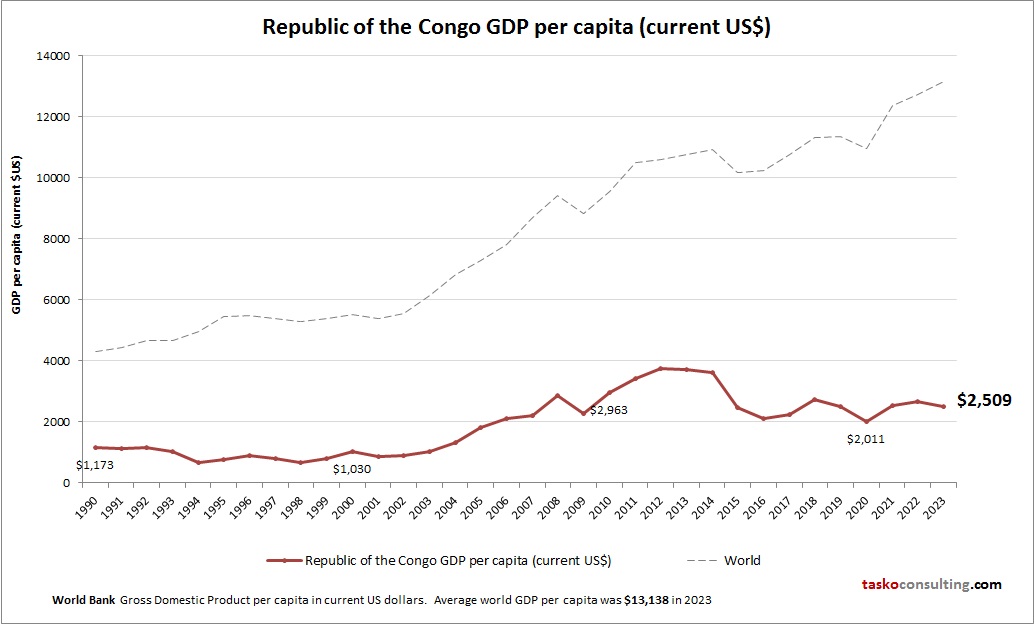
This diagram presents Republic of the Congo GDP per capita. World Bank is the source of this economic data. Based on the latest available information for Republic of the Congo.

Tags: Republic of the Congo data, Republic of the Congo economy, Republic of the Congo GDP per person, Republic of the Congo gross domestic product per capita, Republic of the Congo statistics
This entry was posted in Economy and tagged Republic of the Congo data, Republic of the Congo economy, Republic of the Congo GDP per person, Republic of the Congo gross domestic product per capita, Republic of the Congo statistics by chartdiagram. Bookmark the permalink.

Post navigation

← Previous Previous post: Tech Stack Diagram
Next → Next post: Mckinsey Strategic Horizons Framework

Primary Sidebar Widget Area

Top Diagrams

  • conceptual framework accounting Conceptual Framework Accounting

  • respiratory system diagram Respiratory System Diagram

  • How Stress Affects Human Body How Stress Affects Human Body

  • Bra Sizes – Bra Chart

  • Chemical Elements Chemical Elements

  • Marketin Marketing

  • Post demographic dividend GDP per capita Post demographic dividend GDP per capita

  • Women's Clothing Size Chart Women’s Clothing Size Chart

  • What does agile mean in software development What does agile mean in software development

  • Small states GDP per capita Small states GDP per capita

  • Isle of Man GDP per capita Isle of Man GDP per capita

  • Political Compass Chart Political Compass Chart

  • Business Types Comparison Chart Graphic Business Types Comparison Chart Graphic

  • Modern suit fit explained Modern suit fit explained

  • 1998 Drucker School Of Management Org Chart 1998 Drucker School of Management Org Chart

  • Flowchart of project implementation Flowchart of Project Implementation

  • The core components of leadership The Core Components of Leadership

  • motherboard diagram Motherboard Diagram

  • Marshall Islands GDP per capita Marshall Islands GDP per capita

  • Car Diagram

Latest Posts

  • The Core Components of Leadership
  • Marketing
  • Farming Illustration Diagram
  • Model Governance Framework
  • Flowchart of Project Implementation
  • Post demographic dividend GDP per capita
  • Amazon Web Services
  • Chemical Elements
  • 1998 Drucker School of Management Org Chart
  • Design Tech Intl Wiring Diagram
  • What does agile mean in software development
  • Competency Framework
  • Business Model Template
  • The Visual Mind
  • What is agile a comprehensive guide

Top 20 Tags

  • size (30)
  • food (7)
  • food chart (7)
  • food diagram (7)
  • skin (6)
  • cities (6)
  • world (6)
  • population (6)
  • conversion (6)
  • cancer (5)
  • alcohol diagram (5)
  • sales process diagram (5)
  • car diagram (4)
  • water cycle (4)
  • stress (4)
  • how stress affects body (4)
  • yoga (4)
  • yoga poses (4)
  • yoga workout (4)
  • best yoga (4)

Category

  • Anatomy
  • Business
  • Cancer
  • Clothes
  • Economy
  • Energy
  • Food
  • General
  • Health
  • IT
  • Military
  • Science
  • Sign
  • Sizes
  • Stress
  • Tools
  • Top
  • Women & Men
  • Workout
Copyright © 2026 Charts | Diagrams | Graphs. All Rights Reserved.
Theme: Catch Box by Catch Themes
Scroll Up