Skip to content
cropped cropped chart diagram1 2.png

Charts | Diagrams | Graphs

Charts | Diagrams | Graphs

Menu

Primary menu

  • Top
  • General
    • Upload Diagram
    • Sign
  • Business
  • Economy
  • Sizes
  • Anatomy
  • Health
    • Workout
    • Food
    • Stress
    • Cancer
  • IT
  • Science
    • Energy
  • Women & Men
    • Clothes
    • Military
    • Tools

Tag Archives: Bahrain economy

Bahrain GDP per capita

Posted on September 19, 2025 by chartdiagram
Bahrain GDP per capita

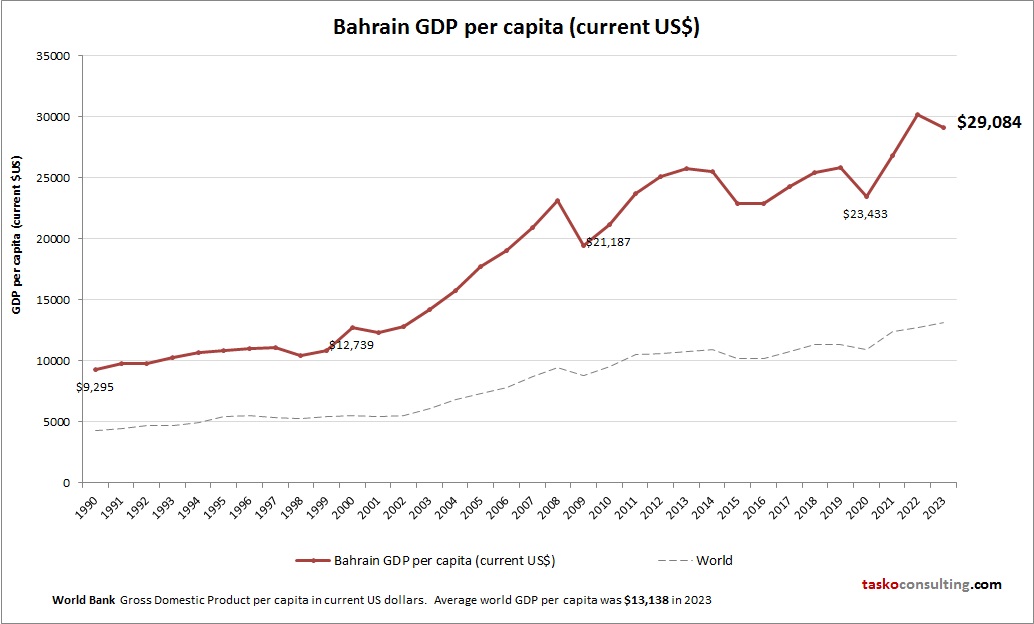
This chart demonstrates Bahrain GDP per capita. World Bank is the source of this economic data. Latest GDP per person information for Bahrain.

Posted in Economy | Tagged Bahrain data, Bahrain economy, Bahrain GDP per person, Bahrain gross domestic product per capita, Bahrain statistics

Primary Sidebar Widget Area

Top Diagrams

  • Agile model of software development the development cycle Agile Model of Software Development the Development Cycle

  • Capsule sizes chart Capsule sizes chart

  • circulatory system Circulatory System

  • essay structure Essay Structure

  • mouth diagram Mouth Diagram

  • Marketing Strategy Diagram Marketing Strategy Diagram

  • Switzerland GDP per capita Switzerland GDP per capita

  • Role of Process Engineering What Is the Role of Process Engineering in the Service Industry?

  • Libya GDP per capita Libya GDP per capita

  • object diagram Object Diagram

  • Parts Of A Bunsen Burner Parts Of A Bunsen Burner

  • Czechia GDP per capita Czechia GDP per capita

  • Wellness

  • Strategic Planning Definition Strategic Planning Definition

  • Women ski size chart Women ski size chart

  • Science Diagrams 42 Science Illustration Diagrams

  • Agile framework illustrated Agile Framework Illustrated

  • Sushi with names Sushi with names

  • Circular Flow Of Income Model Circular Flow Of Income Model

  • Business Model Framework Represented Business Model Framework Represented

Latest Posts

  • Libya GDP per capita
  • Marketing Strategy Diagram
  • Strategic Planning Definition
  • Pestel analysis powerpoint template
  • How agile changed software development
  • Customer Self Service
  • Senegal GDP per capita
  • Computer Science Diagram Examined
  • Business Analysis Competency Model
  • Iraq GDP per capita
  • Marketing And Sales Organization Chart
  • What is agile methodology and how can it help your online shop
  • Enterprise Architecture Blueprint Hospital
  • Scientific Diagrams Of Laboratory Apparatus
  • Increase Efficiency

Top 20 Tags

  • size (30)
  • food (7)
  • food chart (7)
  • food diagram (7)
  • skin (6)
  • cities (6)
  • world (6)
  • population (6)
  • conversion (6)
  • cancer (5)
  • alcohol diagram (5)
  • sales process diagram (5)
  • car diagram (4)
  • water cycle (4)
  • stress (4)
  • how stress affects body (4)
  • yoga (4)
  • yoga poses (4)
  • yoga workout (4)
  • best yoga (4)

Category

  • Anatomy
  • Business
  • Cancer
  • Clothes
  • Economy
  • Energy
  • Food
  • General
  • Health
  • IT
  • Military
  • Science
  • Sign
  • Sizes
  • Stress
  • Tools
  • Top
  • Women & Men
  • Workout
Copyright © 2026 Charts | Diagrams | Graphs. All Rights Reserved.
Theme: Catch Box by Catch Themes
Scroll Up