Skip to content
cropped cropped chart diagram1 2.png

Charts | Diagrams | Graphs

Charts | Diagrams | Graphs

Menu

Primary menu

  • Top
  • General
    • Upload Diagram
    • Sign
  • Business
  • Economy
  • Sizes
  • Anatomy
  • Health
    • Workout
    • Food
    • Stress
    • Cancer
  • IT
  • Science
    • Energy
  • Women & Men
    • Clothes
    • Military
    • Tools

Tag Archives: business analytics visual

Types Of Kpi Indicators

Posted on October 9, 2025 by chartdiagram
Types Of Kpi Indicators

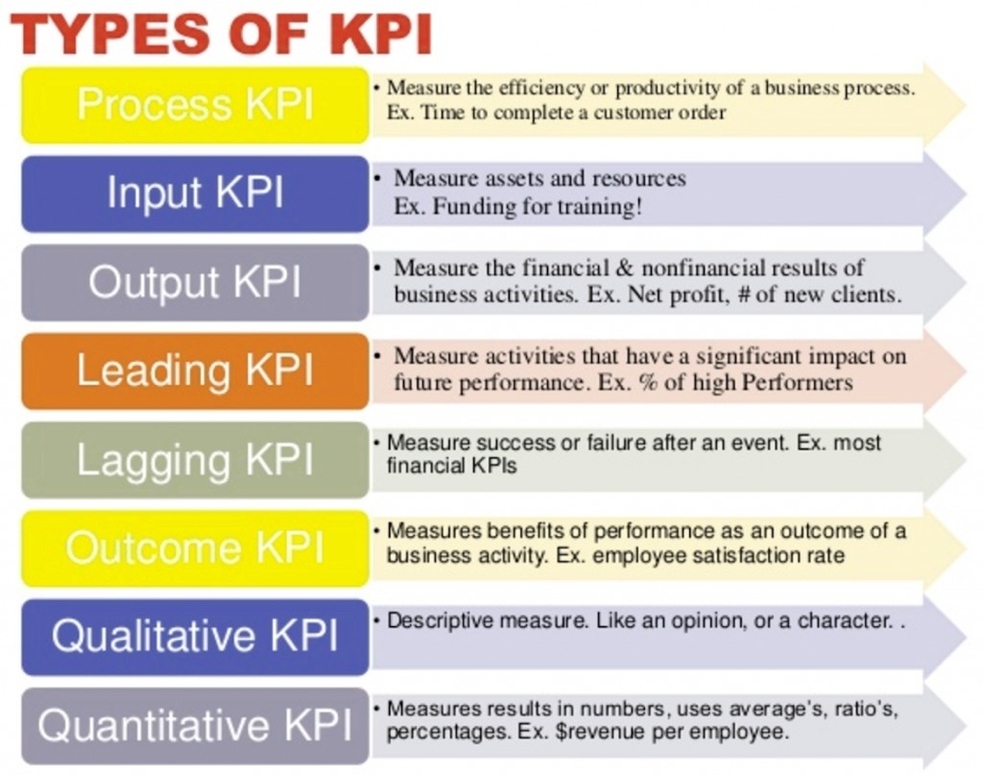
Types Of KPI Indicators: KPI indicators, or Key Performance Indicators, are metrics used to measure performance against objectives. They include financial KPIs, customer KPIs, process KPIs, and employee KPIs.

Posted in Business | Tagged business analytics visual, key indicators chart, KPI types diagram, performance metrics model, strategic measurement tools

Primary Sidebar Widget Area

Top Diagrams

  • World Gdpworld Economy Gdp World Economy Gdp

  • Model Governance Framework Model Governance Framework

  • Features Of Democracy Graphic Organizer Features Of Democracy Graphic Organizer

  • Fastener size chart Fastener size chart

  • Business Model Canvas Sample of Business Model Canvas Sample Of

  • Competency Framework Competency Framework

  • value stream map Value Stream Map

  • How To Draw Circuit Diagram Phy Sic How To Draw Circuit Diagram

  • respiratory system diagram Respiratory System Diagram

  • tornado diagram Tornado Diagram

  • SWOT Analysis

  • electric circuit diagram Electric Circuit Diagram

  • Chemical Elements Chemical Elements

  • Flowchart of project implementation Flowchart of Project Implementation

  • Maslow’s Hierarchy of Needs

  • Project management scrum methodology Project management scrum methodology

  • Design Tech Intl Wiring Diagram Design Tech Intl Wiring Diagram

  • database diagram Database Diagram

  • Amazon Web Services Amazon Web Services

  • stess stress management Stess Stress Management

Latest Posts

  • What is agile what is scrum methodology
  • Stess Stress Management
  • How To Draw Circuit Diagram
  • Timor Leste GDP per capita
  • Business Model Canvas Sample Of
  • How to Manage the People Side of Business
  • Project management scrum methodology
  • Business Process Modeling with ConceptDraw
  • Strategic Planning Models Infographic
  • The Core Components of Leadership
  • Marketing
  • Farming Illustration Diagram
  • Model Governance Framework
  • Flowchart of Project Implementation
  • Post demographic dividend GDP per capita

Top 20 Tags

  • size (30)
  • food (7)
  • food chart (7)
  • food diagram (7)
  • skin (6)
  • cities (6)
  • world (6)
  • population (6)
  • conversion (6)
  • cancer (5)
  • alcohol diagram (5)
  • sales process diagram (5)
  • car diagram (4)
  • water cycle (4)
  • stress (4)
  • how stress affects body (4)
  • yoga (4)
  • yoga poses (4)
  • yoga workout (4)
  • best yoga (4)

Category

  • Anatomy
  • Business
  • Cancer
  • Clothes
  • Economy
  • Energy
  • Food
  • General
  • Health
  • IT
  • Military
  • Science
  • Sign
  • Sizes
  • Stress
  • Tools
  • Top
  • Women & Men
  • Workout
Copyright © 2026 Charts | Diagrams | Graphs. All Rights Reserved.
Theme: Catch Box by Catch Themes
Scroll Up