Skip to content
cropped cropped chart diagram1 2.png

Charts | Diagrams | Graphs

Charts | Diagrams | Graphs

Menu

Primary menu

  • Top
  • General
    • Upload Diagram
    • Sign
  • Business
  • Economy
  • Sizes
  • Anatomy
  • Health
    • Workout
    • Food
    • Stress
    • Cancer
  • IT
  • Science
    • Energy
  • Women & Men
    • Clothes
    • Military
    • Tools

Tag Archives: Cabo Verde statistics

Cabo Verde GDP per capita

Posted on February 14, 2026 by chartdiagram
Cabo Verde GDP per capita

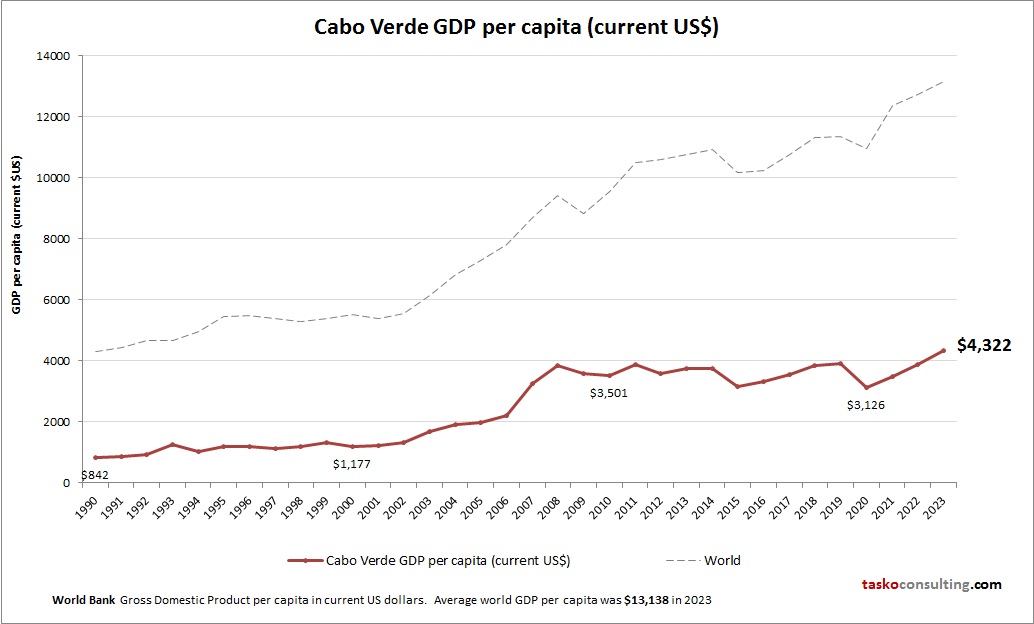
This chart demonstrates Cabo Verde GDP per capita. The gross domestic product statistics are compiled by World Bank. Based on the latest available information for Cabo Verde.

Posted in Economy | Tagged Cabo Verde data, Cabo Verde economy, Cabo Verde GDP per person, Cabo Verde gross domestic product per capita, Cabo Verde statistics

Primary Sidebar Widget Area

Top Diagrams

  • Renaissance Art History Timeline Renaissance Art History Timeline

  • Political Compass Chart Political Compass Chart

  • Cute Venn Diagram Cute Venn Diagram

  • Manufacturing Organizational Charts Manufacturing Organizational Charts

  • bust cup size diagram Bust cup size diagram

  • Phases Of Human Resource Planning Phases Of Human Resource Planning

  • European Union GDP per capita European Union GDP per capita

  • Policy Agenda Policy Agenda

  • Branches Of Philosophy 87 Branches Of Philosophy Diagram

  • Digital transformation framework Digital Transformation Framework

  • Bead size chart Bead size chart

  • Shale Gas Diagram – Shale Oil

  • Learn agile development processes data analytics Learn Agile Development Processes

  • Health Venn Diagram Graphic Health Venn Diagram Graphic

  • Physics Symbols Chart 92 Physics Symbols Explained

  • piano chord chart Piano Chord Chart

  • Finland GDP per capita Finland GDP per capita

  • Switzerland GDP per capita Switzerland GDP per capita

  • muscular system diagram Muscular System Diagram

  • hex color chart Hex Color Chart

Latest Posts

  • Cute Venn Diagram
  • Policy Agenda
  • 4 Steps Business Powerpoint Strategy Diagram
  • What Is Scrum Methodology
  • Marketing Plans
  • jflkdsjfklsdjfd
  • Greece GDP per capita
  • Business Canvas
  • Italy GDP per capita
  • 5 Whys of Lean
  • Turks and Caicos Islands GDP per capita
  • The Components of Leadership Action
  • Central Europe and the Baltics GDP per capita
  • Turkmenistan GDP per capita
  • McKinsey’s Portfolio of Initiatives Framework Template

Top 20 Tags

  • size (30)
  • food (7)
  • food chart (7)
  • food diagram (7)
  • skin (6)
  • cities (6)
  • world (6)
  • population (6)
  • conversion (6)
  • cancer (5)
  • alcohol diagram (5)
  • sales process diagram (5)
  • car diagram (4)
  • water cycle (4)
  • stress (4)
  • how stress affects body (4)
  • yoga (4)
  • yoga poses (4)
  • yoga workout (4)
  • best yoga (4)

Category

  • Anatomy
  • Business
  • Cancer
  • Clothes
  • Economy
  • Energy
  • Food
  • General
  • Health
  • IT
  • Military
  • Science
  • Sign
  • Sizes
  • Stress
  • Tools
  • Top
  • Women & Men
  • Workout
Copyright © 2026 Charts | Diagrams | Graphs. All Rights Reserved.
Theme: Catch Box by Catch Themes
Scroll Up