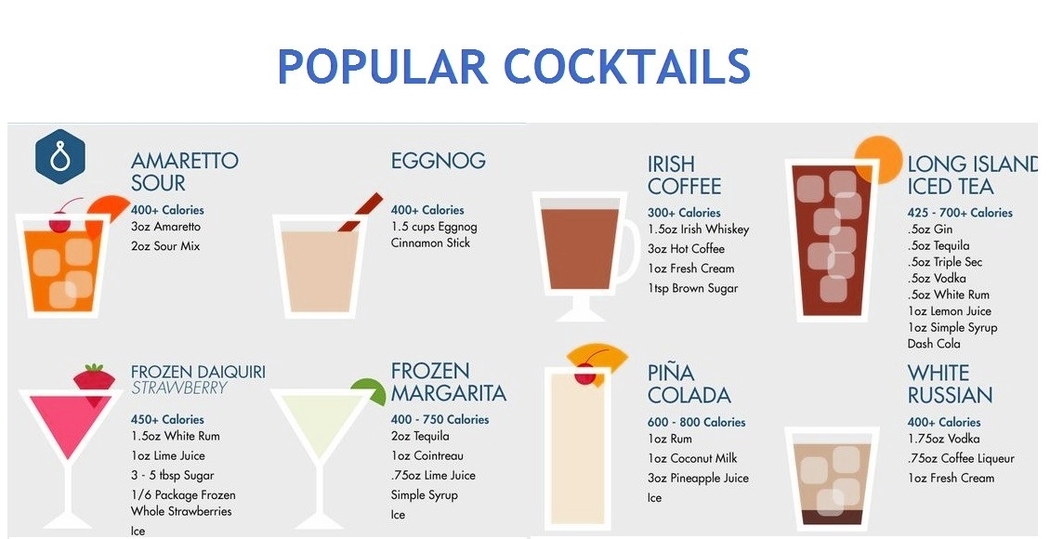
Cocktail Types Explained
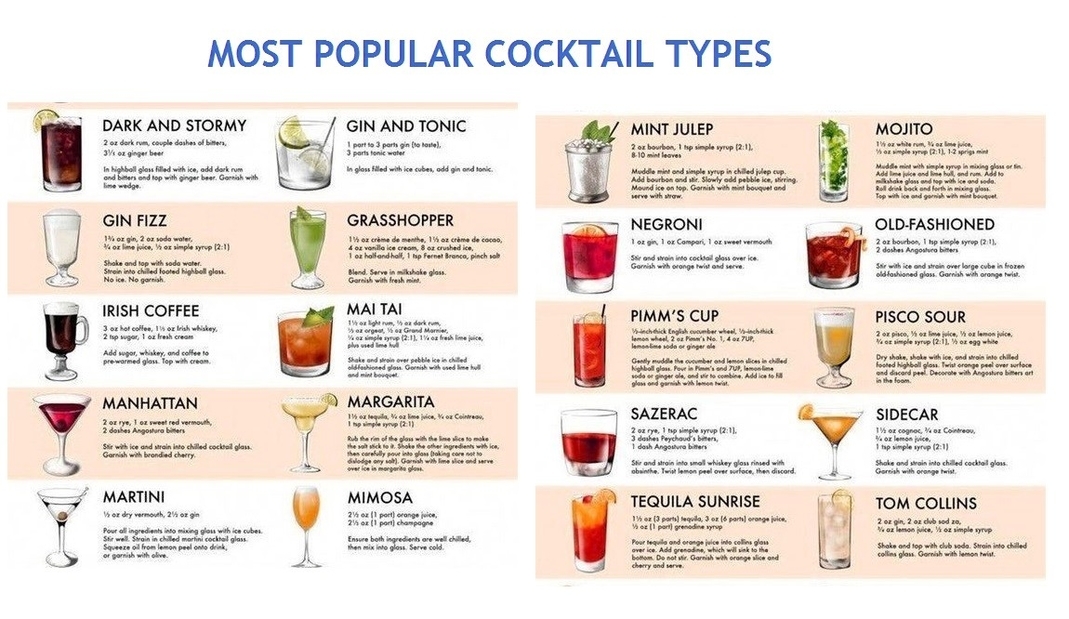
The following diagram depicts various cocktail types inluding some base alcohol, which could be vodka, whiskey, gin, rum, or brandy. They have another liqueur or flavour to add spice to the drink. It could be a juice, milk, cream, or sauce.