Skip to content
cropped cropped chart diagram1 2.png

Charts | Diagrams | Graphs

Charts | Diagrams | Graphs

Menu

Primary menu

  • Top
  • General
    • Upload Diagram
    • Sign
  • Business
  • Economy
  • Sizes
  • Anatomy
  • Health
    • Workout
    • Food
    • Stress
    • Cancer
  • IT
  • Science
    • Energy
  • Women & Men
    • Clothes
    • Military
    • Tools

Tag Archives: lean manufacturing visual

Lean Process Improvement

Posted on October 16, 2025 by chartdiagram
Lean Process Improvement

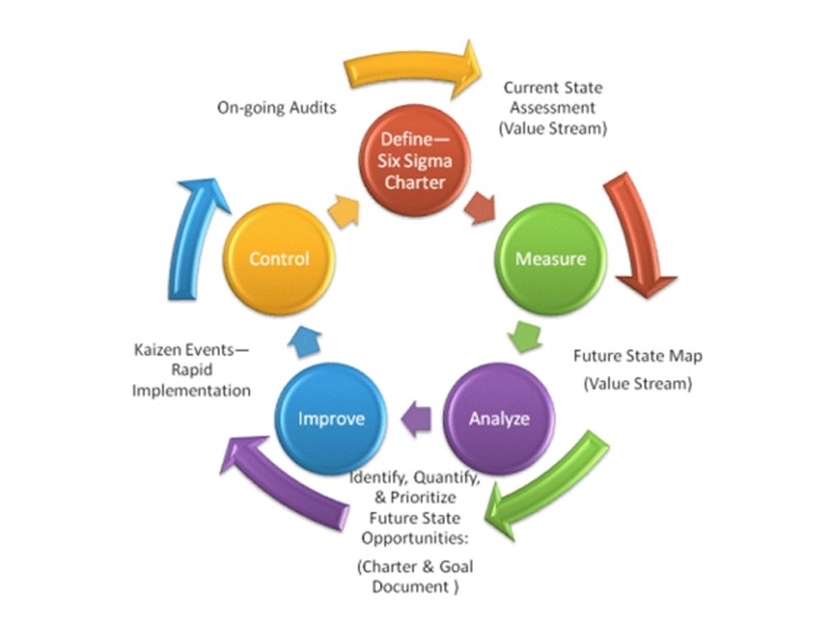
Lean Process Improvement: Lean process improvement focuses on eliminating waste, improving efficiency, and delivering value to customers. It involves tools like value stream mapping and continuous improvement cycles (Kaizen).

Posted in Business | Tagged continuous improvement model, lean business flow, lean manufacturing visual, lean process diagram, process optimization strategy

Primary Sidebar Widget Area

Top Diagrams

  • Political Compass Chart Political Compass Chart

  • Renaissance Art History Timeline Renaissance Art History Timeline

  • 4 Steps Business Powerpoint Strategy Diagram 4 Steps Business Powerpoint Strategy Diagram

  • UML Diagram

  • capsule size and weight chart Capsule size and weight chart

  • Fastener size chart Fastener size chart

  • frame size seat height chart Bike Frame Size and Seat Height Chart

  • Policy Agenda Policy Agenda

  • motherboard diagram Motherboard Diagram

  • Wellness

  • 4ps of marketing 4ps Of Marketing

  • weight chart Weight Chart

  • Computer Science Diagram Explanation Computer Science Diagram Explanation

  • Financial Planning Pyramid Infographic Chart Vector Financial Planning Pyramid Infographic Chart Vector

  • Branches Of Philosophy 87 Branches Of Philosophy Diagram

  • Maslow’s Hierarchy of Needs

  • Selina Physics Selina Physics

  • circulatory system Circulatory System

  • obesity chart Obesity Chart

  • just in time just in time

Latest Posts

  • Policy Agenda
  • 4 Steps Business Powerpoint Strategy Diagram
  • What Is Scrum Methodology
  • Marketing Plans
  • jflkdsjfklsdjfd
  • Greece GDP per capita
  • Business Canvas
  • Italy GDP per capita
  • 5 Whys of Lean
  • Turks and Caicos Islands GDP per capita
  • The Components of Leadership Action
  • Central Europe and the Baltics GDP per capita
  • Turkmenistan GDP per capita
  • McKinsey’s Portfolio of Initiatives Framework Template
  • Risk Analysis

Top 20 Tags

  • size (30)
  • food (7)
  • food chart (7)
  • food diagram (7)
  • skin (6)
  • cities (6)
  • world (6)
  • population (6)
  • conversion (6)
  • cancer (5)
  • alcohol diagram (5)
  • sales process diagram (5)
  • car diagram (4)
  • water cycle (4)
  • stress (4)
  • how stress affects body (4)
  • yoga (4)
  • yoga poses (4)
  • yoga workout (4)
  • best yoga (4)

Category

  • Anatomy
  • Business
  • Cancer
  • Clothes
  • Economy
  • Energy
  • Food
  • General
  • Health
  • IT
  • Military
  • Science
  • Sign
  • Sizes
  • Stress
  • Tools
  • Top
  • Women & Men
  • Workout
Copyright © 2026 Charts | Diagrams | Graphs. All Rights Reserved.
Theme: Catch Box by Catch Themes
Scroll Up