Skip to content
cropped cropped chart diagram1 2.png

Charts | Diagrams | Graphs

Charts | Diagrams | Graphs

Menu

Primary menu

  • Top
  • General
    • Upload Diagram
    • Sign
  • Business
  • Economy
  • Sizes
  • Anatomy
  • Health
    • Workout
    • Food
    • Stress
    • Cancer
  • IT
  • Science
    • Energy
  • Women & Men
    • Clothes
    • Military
    • Tools

Tag Archives: lean root cause analysis

5 Whys of Lean

Posted on March 2, 2026 by chartdiagram
5 Whys of Lean

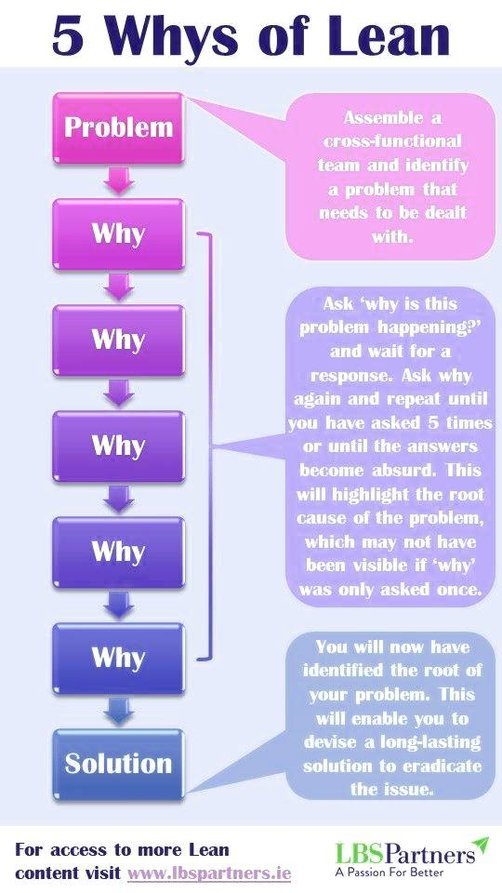
5 Whys of Lean: The 5 Whys of Lean is a problem-solving technique used to identify the root cause of a problem by asking “Why?” five times. It encourages teams to dig deeper into the issue, improving process efficiency and eliminating waste, ultimately leading to better performance and quality.

Posted in Business | Tagged 5 Whys diagram, continuous improvement, lean methodology, lean root cause analysis, problem solving tool

Primary Sidebar Widget Area

Top Diagrams

  • Political Compass Chart Political Compass Chart

  • Types of Skin Cancer Types of Skin Cancer

  • Human Organs – Body Organs Systems

  • Plot Diagram

  • Bra Sizes – Bra Chart

  • muscular system diagram Muscular System Diagram

  • Arab World GDP per capita Arab World GDP per capita

  • Baby Month by Month – Pregnancy Stages

  • Stanford Design Thinking Process Stanford Design Thinking Process

  • Cuba GDP per capita Cuba GDP per capita

  • Ear Diagram – Ear Anatomy

  • frog diagram Frog Diagram

  • Functions of product management in the agile enterprise Functions of Product Management in the Agile Enterprise

  • Multi Cloud Environment with IaaS PaaS and SaaS Multi-Cloud Environment with IaaS, PaaS, and SaaS

  • Converation Biology Concept Map Diagram Example Converation Biology Concept Map Diagram Example

  • Finland GDP per capita Finland GDP per capita

  • blood flow diagram Blood Flow Diagram

  • Biology Plant Cell Diagram Biology Plant Cell Diagram

  • Kotter change management Kotter Change Management

  • conceptual framework accounting Conceptual Framework Accounting

Latest Posts

  • Situational leadership style diagram
  • Arab World GDP per capita
  • Functions of Product Management in the Agile Enterprise
  • Sales Flowchart Process
  • Core Competence Business Model Powerpoint Presentation
  • Cybersecurity
  • Ethiopia GDP per capita
  • Brain Diagram Sample
  • Characteristics Of Planning
  • Transformational leadership model
  • Cloud Computing Services
  • Converation Biology Concept Map Diagram Example
  • Change Management Phases
  • Business Impact Analysis Archives
  • Supply Chain Management Flow

Top 20 Tags

  • size (30)
  • food (7)
  • food chart (7)
  • food diagram (7)
  • skin (6)
  • cities (6)
  • world (6)
  • population (6)
  • conversion (6)
  • cancer (5)
  • alcohol diagram (5)
  • business strategy diagram (5)
  • sales process diagram (5)
  • car diagram (4)
  • water cycle (4)
  • stress (4)
  • how stress affects body (4)
  • yoga (4)
  • yoga poses (4)
  • yoga workout (4)

Category

  • Anatomy
  • Business
  • Cancer
  • Clothes
  • Economy
  • Energy
  • Food
  • General
  • Health
  • IT
  • Military
  • Science
  • Sign
  • Sizes
  • Stress
  • Tools
  • Top
  • Women & Men
  • Workout
Copyright © 2026 Charts | Diagrams | Graphs. All Rights Reserved.
Theme: Catch Box by Catch Themes
Scroll Up