
Skip to content
cropped cropped chart diagram1 2.png

Charts | Diagrams | Graphs

Charts | Diagrams | Graphs

Menu

Primary menu

  • Top
  • General
    • Upload Diagram
    • Sign
  • Business
  • Economy
  • Sizes
  • Anatomy
  • Health
    • Workout
    • Food
    • Stress
    • Cancer
  • IT
  • Science
    • Energy
  • Women & Men
    • Clothes
    • Military
    • Tools

Tag Archives: swimlane diagram

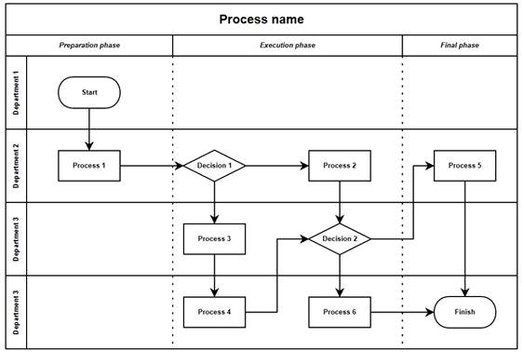
Process Map with Swimlanes
Posted on February 20, 2026 by chartdiagram
Process Map with Swimlanes

Process Map with Swimlanes: A process map with swimlanes organizes tasks by department or stakeholder, showing who is responsible for each step in a process. It enhances clarity, improves coordination, and helps identify inefficiencies or gaps across cross-functional workflows.

Posted in Business | Tagged BPM diagram, business flowchart, cross-functional process, process mapping example, swimlane diagram

Primary Sidebar Widget Area

Top Diagrams

  • liver diagram Liver Diagram
  • Azerbaijan GDP per capita Azerbaijan GDP per capita
  • Phases of project management Phases of Project Management
  • circulatory system Circulatory System
  • Ireland GDP per capita Ireland GDP per capita
  • Old Science Diagrams Old Science Diagrams
  • Car Fluids Diagram Car Fluids Diagram
  • Business Process Workflow Diagram Business Process Workflow Diagram
  • cardiovascular system Cardiovascular System
  • Brain Structure Representation Brain Structure Representation
  • smith chart Smith Chart
  • Quantum Physics Diagram Quantum Physics Diagram
  • Agile model of software development the development cycle Agile Model of Software Development the Development Cycle
  • Mali GDP per capita Mali GDP per capita
  • bone diagram Bone Diagram
  • Project roles and responsibilities Project roles and responsibilities
  • star diagram Star Diagram
  • Left Right Political Spectrum Left Right Political Spectrum
  • Cell Diagram
  • Some Kids Daigram On Health Infrastucture Some Kids Daigram On Health Infrastucture

Latest Posts

  • Investment Pyramid Managing Risk
  • Ireland GDP per capita
  • Australia GDP per capita
  • Marketing Sales Funnel Described In Detail
  • Corporate Governance Best Practices
  • Business Performance Improvement
  • How Banks Make Money
  • Strategic Management Framework Diagram
  • Innovation Bell Curve
  • Absent On The Finger Screen Machine
  • Cloud Computing Diagram
  • Sweden GDP per capita
  • Cutting edge classic situational leadership
  • Network Diagram
  • American Samoa GDP per capita

Top 20 Tags

  • size (30)
  • cloud computing diagram (7)
  • food (7)
  • food chart (7)
  • food diagram (7)
  • skin (6)
  • cities (6)
  • world (6)
  • population (6)
  • conversion (6)
  • strategic planning tool (6)
  • cancer (5)
  • alcohol diagram (5)
  • business strategy diagram (5)
  • business model canvas (5)
  • sales process diagram (5)
  • strategic planning diagram (5)
  • agile project management (5)
  • leadership skills diagram (5)
  • car diagram (4)

Category

  • Anatomy
  • Business
  • Cancer
  • Clothes
  • Economy
  • Energy
  • Food
  • General
  • Health
  • IT
  • Military
  • Science
  • Sign
  • Sizes
  • Stress
  • Tools
  • Top
  • Women & Men
  • Workout
Copyright © 2026 Charts | Diagrams | Graphs. All Rights Reserved.
Theme: Catch Box by Catch Themes
Scroll Up