Skip to content
cropped cropped chart diagram1 2.png

Charts | Diagrams | Graphs

Charts | Diagrams | Graphs

Menu

Primary menu

  • Top
  • General
    • Upload Diagram
    • Sign
  • Business
  • Economy
  • Sizes
  • Anatomy
  • Health
    • Workout
    • Food
    • Stress
    • Cancer
  • IT
  • Science
    • Energy
  • Women & Men
    • Clothes
    • Military
    • Tools

Tag Archives: wind energy

Wind Power Diagram

Posted on April 29, 2021 by chartdiagram
Wind Power Diagram

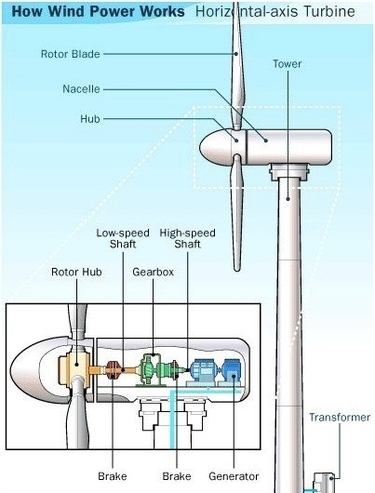
The diagram of the wind turbine above is a side view of a horizontal axis wind turbine with the turbine blades on the left. Most modern wind turbines are built with a horizontal-axis similar to the one seen in the figure.

Posted in Energy | Tagged how does wind energy work, wind energy, wind energy diagram, wind energy explained, wind mill, wind power, wind power diagram, wind power explained

Wind Energy Explained

Posted on April 13, 2021 by chartdiagram
Wind Energy Explained

How does wind generate electricity? Wind energy diagram below depicts the process of converting wind energy into electrical energy and various components involved, such as wind mills, batteries, generators, transformers, grid and inverters.

Posted in Energy | Tagged how does wind energy work, wind energy, wind energy diagram, wind energy explained, wind mill, wind power, wind power diagram, wind power explained

Primary Sidebar Widget Area

Top Diagrams

  • Banking System Flowchart Banking System Flowchart

  • Africa Eastern and Southern GDP per capita Africa Eastern and Southern GDP per capita

  • Agile model of software development the development cycle Agile Model of Software Development the Development Cycle

  • frame size seat height chart Bike Frame Size and Seat Height Chart

  • Full comparison agile vs. scrum vs. waterfall methodology Full comparison agile vs. scrum vs. waterfall methodology

  • obesity chart Obesity Chart

  • Leadership qualities model Leadership Qualities Model

  • Renaissance Art History Timeline Renaissance Art History Timeline

  • Tech Stack Diagram Tech Stack Diagram

  • Services value chain analysis Services Value Chain Analysis

  • Types of Skin Cancer Types of Skin Cancer

  • Solar Panel Electricity Explained Solar Panel Electricity Explained

  • Mens boxer briefs size chart Mens boxer briefs size chart

  • Human Eye – Eye Diagram

  • fracking diagram Fracking Diagram

  • Cocktail Types Explained Cocktail Types Explained

  • Branches Of Science Example Branches Of Science Example

  • Project life cycle powerpoint template Project life cycle powerpoint template

  • Biology Diagrams Example Of Biology Diagrams Example Of

  • World Economy Gdp Comparison World Economy Gdp Comparison

Latest Posts

  • Africa Eastern and Southern GDP per capita
  • Banking System Flowchart
  • Computer Science Diagram Sample
  • Gambia GDP per capita
  • Agile Project Management with Scrum Training Material
  • Oman GDP per capita
  • Communication Plan
  • Cabo Verde GDP per capita
  • World Geography Map
  • RACI Chart
  • Leadership levels diagram template
  • Sales And Marketing Org Chart Template
  • Maloney’s Diffusion of Innovation
  • Agile Framework
  • Strategy Services Include a Focus on Change Management

Top 20 Tags

  • size (30)
  • food (7)
  • food chart (7)
  • food diagram (7)
  • skin (6)
  • cities (6)
  • world (6)
  • population (6)
  • conversion (6)
  • cancer (5)
  • alcohol diagram (5)
  • sales process diagram (5)
  • car diagram (4)
  • water cycle (4)
  • stress (4)
  • how stress affects body (4)
  • yoga (4)
  • yoga poses (4)
  • yoga workout (4)
  • best yoga (4)

Category

  • Anatomy
  • Business
  • Cancer
  • Clothes
  • Economy
  • Energy
  • Food
  • General
  • Health
  • IT
  • Military
  • Science
  • Sign
  • Sizes
  • Stress
  • Tools
  • Top
  • Women & Men
  • Workout
Copyright © 2026 Charts | Diagrams | Graphs. All Rights Reserved.
Theme: Catch Box by Catch Themes
Scroll Up