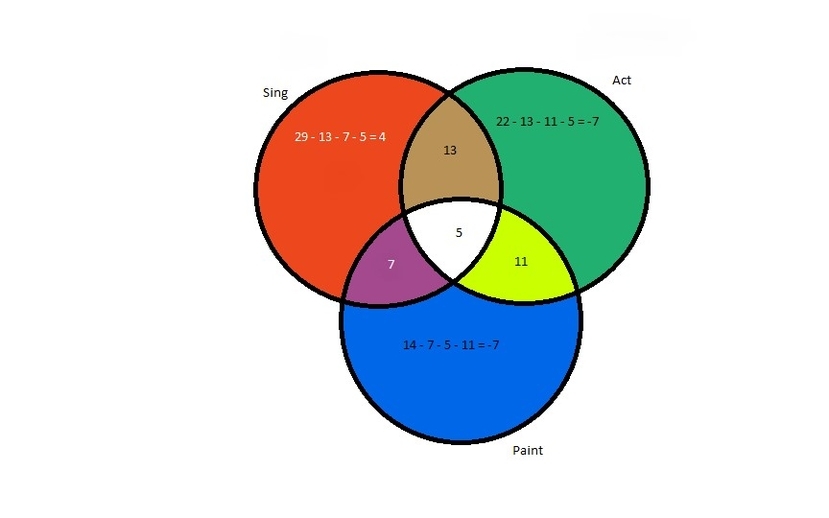
Venn Diagram Problem Solving

Venn Diagram Problem Solving: this diagram is one of our most searched charts and infographics by people seeking to learn about new things and improve their general knowledge of how the world works.

Venn Diagram Problem Solving

Venn Diagrams are a powerful tool for visualizing relationships between sets. They are used in many areas such as statistics, data science, business, set theory, math, logic, and more. A Venn diagram is an illustration that shows logical relationships between two or more sets (grouping items). Venn diagrams use circles (both overlapping and non-overlapping) or other shapes. Commonly, Venn diagrams show how given items are similar and different. Despite Venn diagrams with 2 or 3 circles being the most common type, there are also many diagrams with a larger number of circles (5,6,7,8,10…). Theoretically, they can have unlimited circles.

The Venn diagram is named after John Venn, a British logician and philosopher who introduced the diagram in 1880. The diagram is used to represent the relationship between two or more sets. The sets are represented by circles, and the overlapping regions between the circles represent the intersection of the sets. The non-overlapping regions represent the difference between the sets.

Venn diagrams are used to solve problems that involve sets. They are a useful tool for organizing information and visualizing relationships between sets. Venn diagrams can be used to solve problems in many areas such as statistics, data science, business, set theory, math, logic, and more.

To solve problems using Venn diagrams, you need to follow a few simple steps. First, you need to understand the problem. What sets are involved? How are they related? What are you being asked to find? Second, you need to draw the diagram. Draw a rectangle to represent the universal set, which includes all possible elements. Each circle (set) should be labeled appropriately. Third, you need to fill in the values. Fill in the values for the sets and the intersection of the sets. Fourth, you need to solve the problem. Use the values you have filled in to solve the problem. Finally, you need to check your answer. Make sure your answer makes sense and is correct.

Here is an example of a problem that can be solved using a Venn diagram:
uppose that in a town, 800 people are selected by random types of sampling methods. 280 go to work by car only, 220 go to work by bicycle only and 140 use both ways – sometimes go with a car and sometimes with a bicycle. Here are some important questions we will find the answers:

– How many people go to work by car only?
– How many people go to work by bicycle only?
– How many people go by neither car nor bicycle?
– How many people use at least one of both transportation types?
– How many people use only one of car or bicycle?

The following Venn diagram represents the data above:

![Venn Diagram Example](https://www.intellspot.com/wp-content/uploads/2019/06/venn-diagram-examples-problems-solutions.png)

Now, we are going to answer our questions:

– Number of people who go to work by car only = 280
– Number of people who go to work by bicycle only = 220
– Number of people who go by neither car nor bicycle = 160
– Number of people who use at least one of both transportation types = n (only car) + n (only bicycle) + n (both car and bicycle) = 280 + 220 + 140 = 640
– Number of people who use only one of car or bicycle = n (only car) + n (only bicycle) = 280 + 220 = 500