Skip to content
cropped cropped chart diagram1 2.png

Charts | Diagrams | Graphs

Charts | Diagrams | Graphs

Menu

Primary menu

  • Top
  • General
    • Upload Diagram
    • Sign
  • Business
  • Economy
  • Sizes
  • Anatomy
  • Health
    • Workout
    • Food
    • Stress
    • Cancer
  • IT
  • Science
    • Energy
  • Women & Men
    • Clothes
    • Military
    • Tools

Fragile and conflict affected situations GDP per capita

Posted on August 29, 2025 by chartdiagram
Fragile and conflict affected situations GDP per capita

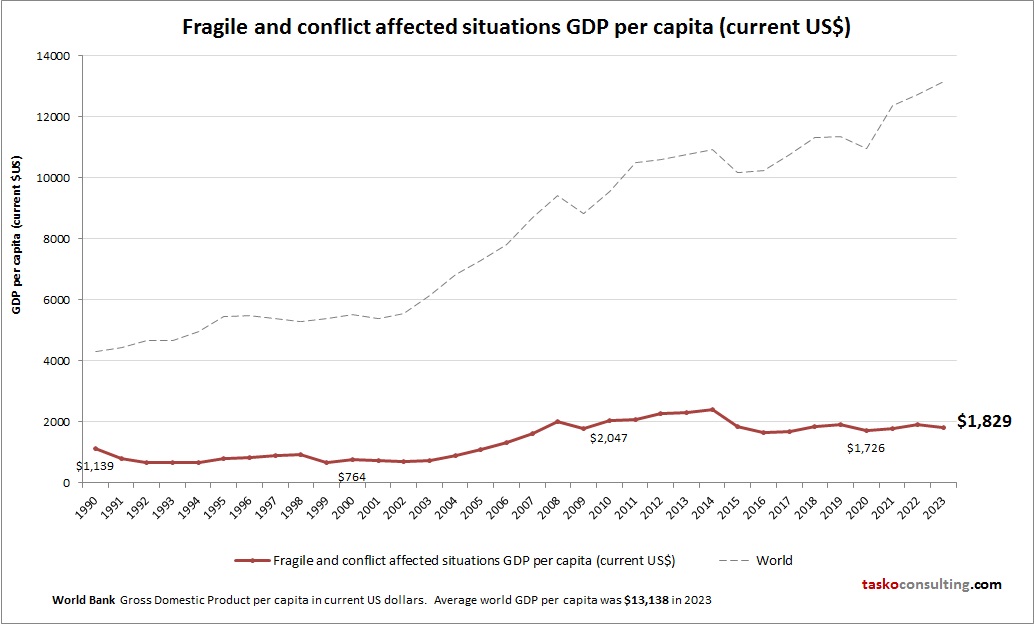
This diagram presents Fragile and conflict affected situations GDP per capita. World Bank is the source of this economic data. Latest GDP per person information for Fragile and conflict affected situations.

Tags: Fragile and conflict affected situations data, Fragile and conflict affected situations economy, Fragile and conflict affected situations GDP per person, Fragile and conflict affected situations gross domestic product per capita, Fragile and conflict affected situations statistics
This entry was posted in Economy and tagged Fragile and conflict affected situations data, Fragile and conflict affected situations economy, Fragile and conflict affected situations GDP per person, Fragile and conflict affected situations gross domestic product per capita, Fragile and conflict affected situations statistics by chartdiagram. Bookmark the permalink.

Post navigation

← Previous Previous post: Agile process for travel application development
Next → Next post: The Lobe Of The Brain Like Axon

Primary Sidebar Widget Area

Top Diagrams

  • Agile model of software development the development cycle Agile Model of Software Development the Development Cycle

  • endocrine system diagram Endocrine System Diagram

  • New product launch New Product Launch

  • Relationship Diagram

  • Women's Clothing Size Chart Women’s Clothing Size Chart

  • Computer Science Diagram Explanation Computer Science Diagram Explanation

  • Tunisia GDP per capita Tunisia GDP per capita

  • Kubernetes Web Application Architecture Kubernetes Web Application Architecture

  • value stream map Value Stream Map

  • Process Map Symbols Process Map Symbols

  • preschool sizing chart Preschool sizing chart

  • circulatory system Circulatory System

  • Electromagnetic Wave Diagram For 10th Class Physical Science Electromagnetic Wave Diagram For 10th Class Physical Science

  • liver diagram Liver Diagram

  • Muscle Diagram – Body Muscles

  • Vertical Farming Vertical Farming

  • Baby Month by Month – Pregnancy Stages

  • Maslow’s Hierarchy of Needs

  • Psychological Types Diagram Psychological Types Diagram

  • Situational leadership model Situational Leadership Model

Latest Posts

  • Kubernetes Web Application Architecture
  • New Product Launch
  • Modern Circle Diagram Template for PowerPoint
  • Afghanistan GDP per capita
  • Leadership and Management
  • Enterprise Business Architecture Framework
  • Human Excretory System Represented
  • BeFunky Collage
  • Adkar change management model google slides templates
  • Marketing Sales Funnel
  • Leadership Pyramid Leadership
  • Learning for Life Programme Community
  • Best change management images on pinterest
  • Leadership Diagram Circle
  • Business Concept Diagram

Top 20 Tags

  • size (30)
  • food (7)
  • food chart (7)
  • food diagram (7)
  • skin (6)
  • cities (6)
  • world (6)
  • population (6)
  • conversion (6)
  • cancer (5)
  • alcohol diagram (5)
  • business strategy diagram (5)
  • sales process diagram (5)
  • car diagram (4)
  • water cycle (4)
  • stress (4)
  • how stress affects body (4)
  • yoga (4)
  • yoga poses (4)
  • yoga workout (4)

Category

  • Anatomy
  • Business
  • Cancer
  • Clothes
  • Economy
  • Energy
  • Food
  • General
  • Health
  • IT
  • Military
  • Science
  • Sign
  • Sizes
  • Stress
  • Tools
  • Top
  • Women & Men
  • Workout
Copyright © 2026 Charts | Diagrams | Graphs. All Rights Reserved.
Theme: Catch Box by Catch Themes
Scroll Up