Skip to content
cropped cropped chart diagram1 2.png

Charts | Diagrams | Graphs

Charts | Diagrams | Graphs

Menu

Primary menu

  • Top
  • General
    • Upload Diagram
    • Sign
  • Business
  • Economy
  • Sizes
  • Anatomy
  • Health
    • Workout
    • Food
    • Stress
    • Cancer
  • IT
  • Science
    • Energy
  • Women & Men
    • Clothes
    • Military
    • Tools

Tag Archives: continuity analysis

Business Impact Analysis Archives

Posted on April 29, 2026 by chartdiagram
Business impact analysis archives

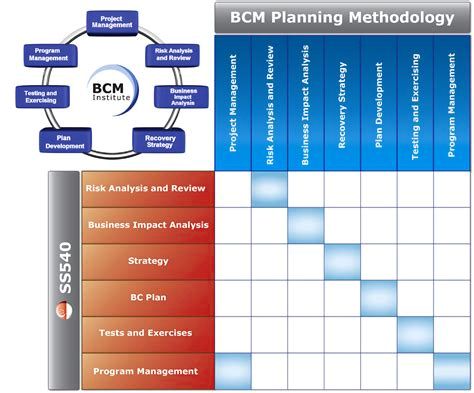
Business Impact Analysis Archives: Business Impact Analysis (BIA) archives contain historical data on potential disruptions and their effects. This data helps businesses prepare for future risks by identifying critical functions and estimating downtime impact.

Posted in Business | Tagged BIA framework, business impact assessment, business risk management visual, continuity analysis, risk impact analysis model

Primary Sidebar Widget Area

Top Diagrams

  • Political Compass Chart Political Compass Chart

  • Types of Skin Cancer Types of Skin Cancer

  • muscular system diagram Muscular System Diagram

  • Plot Diagram

  • Functions of product management in the agile enterprise Functions of Product Management in the Agile Enterprise

  • Bra Sizes – Bra Chart

  • Maslow’s Hierarchy of Needs

  • Agile model of software development the development cycle Agile Model of Software Development the Development Cycle

  • Arab World GDP per capita Arab World GDP per capita

  • Stanford Design Thinking Process Stanford Design Thinking Process

  • Cuba GDP per capita Cuba GDP per capita

  • Ear Diagram – Ear Anatomy

  • Women's Clothing Size Chart Women’s Clothing Size Chart

  • Increase Efficiency Increase Efficiency

  • Pareto Diagram – Pareto Chart

  • Business Intelligence Framework Process Infographic Business Intelligence Framework Process Infographic

  • frog diagram Frog Diagram

  • Human Organs – Body Organs Systems

  • Multi Cloud Environment with IaaS PaaS and SaaS Multi-Cloud Environment with IaaS, PaaS, and SaaS

  • Converation Biology Concept Map Diagram Example Converation Biology Concept Map Diagram Example

Latest Posts

  • Situational leadership style diagram
  • Arab World GDP per capita
  • Functions of Product Management in the Agile Enterprise
  • Sales Flowchart Process
  • Core Competence Business Model Powerpoint Presentation
  • Cybersecurity
  • Ethiopia GDP per capita
  • Brain Diagram Sample
  • Characteristics Of Planning
  • Transformational leadership model
  • Cloud Computing Services
  • Converation Biology Concept Map Diagram Example
  • Change Management Phases
  • Business Impact Analysis Archives
  • Supply Chain Management Flow

Top 20 Tags

  • size (30)
  • food (7)
  • food chart (7)
  • food diagram (7)
  • skin (6)
  • cities (6)
  • world (6)
  • population (6)
  • conversion (6)
  • cancer (5)
  • alcohol diagram (5)
  • business strategy diagram (5)
  • sales process diagram (5)
  • car diagram (4)
  • water cycle (4)
  • stress (4)
  • how stress affects body (4)
  • yoga (4)
  • yoga poses (4)
  • yoga workout (4)

Category

  • Anatomy
  • Business
  • Cancer
  • Clothes
  • Economy
  • Energy
  • Food
  • General
  • Health
  • IT
  • Military
  • Science
  • Sign
  • Sizes
  • Stress
  • Tools
  • Top
  • Women & Men
  • Workout
Copyright © 2026 Charts | Diagrams | Graphs. All Rights Reserved.
Theme: Catch Box by Catch Themes
Scroll Up