Skip to content
cropped cropped chart diagram1 2.png

Charts | Diagrams | Graphs

Charts | Diagrams | Graphs

Menu

Primary menu

  • Top
  • General
    • Upload Diagram
    • Sign
  • Business
  • Economy
  • Sizes
  • Anatomy
  • Health
    • Workout
    • Food
    • Stress
    • Cancer
  • IT
  • Science
    • Energy
  • Women & Men
    • Clothes
    • Military
    • Tools

Tag Archives: Finland GDP per person

Finland GDP per capita

Posted on November 6, 2025 by chartdiagram
Finland GDP per capita

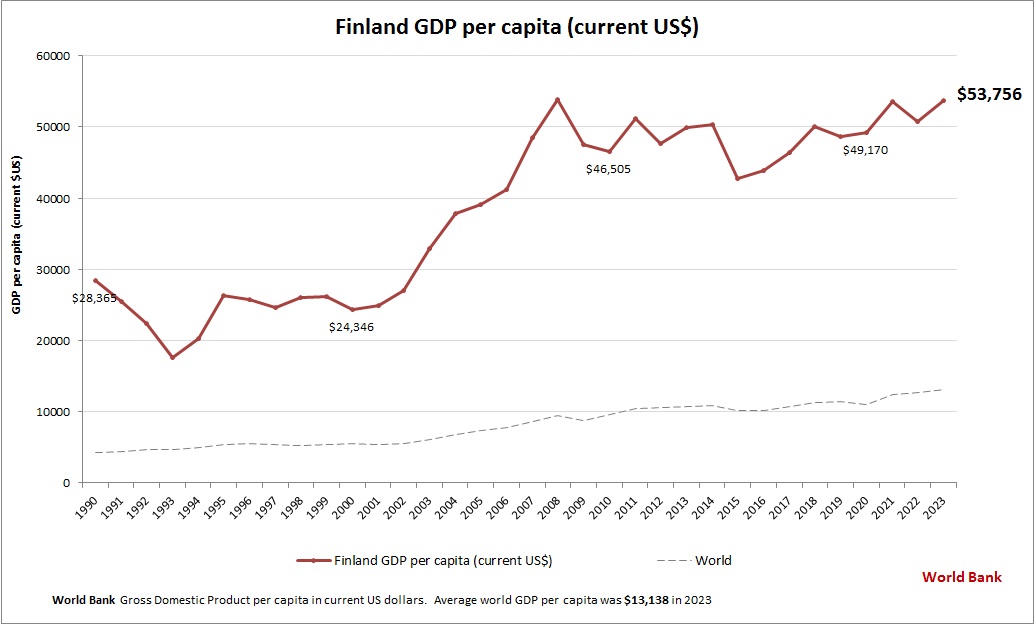
This chart demonstrates Finland GDP per capita. This is according to World Bank GDP stats by country. Based on the latest available information for Finland.

Posted in Economy | Tagged Finland data, Finland economy, Finland GDP per person, Finland gross domestic product per capita, Finland statistics

Primary Sidebar Widget Area

Top Diagrams

  • Agile model of software development the development cycle Agile Model of Software Development the Development Cycle

  • Cloud Service Models Graphic Cloud Service Models Graphic

  • Switzerland GDP per capita Switzerland GDP per capita

  • Standard Model Of Particle Physics 84 Standard Model Of Particle

  • How Technology Works Blockchain How Technology Works Blockchain

  • Stress Effect on Physical Health Stress Effect on Physical Health

  • Scrum diagram the scrum framework captured in simple one picture Scrum Diagram

  • Women's Clothing Size Chart Women’s Clothing Size Chart

  • Regenerative Agriculture 51 Regenerative Agriculture Diagram

  • Strategic Planning Institutional Effectiveness Strategic Planning Institutional Effectiveness

  • 4ps of marketing 4ps Of Marketing

  • Plot Diagram

  • Color symbolism chart Color symbolism chart

  • Political Compass Chart Political Compass Chart

  • Introduction to Strategic Planning Framework Introduction To Strategic Planning Framework

  • Earth With Latitude And Longitude Lines Earth With Latitude And Longitude Lines

  • Anatomy Diagram

  • How Stress Affects Human Body How Stress Affects Human Body

  • Computer Science Diagram 76 Computer Science Flow Diagram

  • Maslow’s Hierarchy of Needs

Latest Posts

  • Enterprise Architecture Frameworks Clarified
  • Switzerland GDP per capita
  • History Mind Map
  • Czechia GDP per capita
  • Money Flow Chart
  • Greenland GDP per capita
  • NVIDIA SWOT Analysis
  • Transformational leadership what is it
  • Freud’s Id, Ego And Superego
  • Tanzania GDP per capita
  • Company Strategic Framework
  • Diagrams Of Physics
  • Creative Thinking Diverge Converge Diamond Diagram
  • Farming Explained
  • Increase Business Improve Sales

Top 20 Tags

  • size (30)
  • food (7)
  • food chart (7)
  • food diagram (7)
  • skin (6)
  • cities (6)
  • world (6)
  • population (6)
  • conversion (6)
  • cancer (5)
  • alcohol diagram (5)
  • sales process diagram (5)
  • car diagram (4)
  • water cycle (4)
  • stress (4)
  • how stress affects body (4)
  • yoga (4)
  • yoga poses (4)
  • yoga workout (4)
  • best yoga (4)

Category

  • Anatomy
  • Business
  • Cancer
  • Clothes
  • Economy
  • Energy
  • Food
  • General
  • Health
  • IT
  • Military
  • Science
  • Sign
  • Sizes
  • Stress
  • Tools
  • Top
  • Women & Men
  • Workout
Copyright © 2026 Charts | Diagrams | Graphs. All Rights Reserved.
Theme: Catch Box by Catch Themes
Scroll Up