Skip to content
cropped cropped chart diagram1 2.png

Charts | Diagrams | Graphs

Charts | Diagrams | Graphs

Menu

Primary menu

  • Top
  • General
    • Upload Diagram
    • Sign
  • Business
  • Economy
  • Sizes
  • Anatomy
  • Health
    • Workout
    • Food
    • Stress
    • Cancer
  • IT
  • Science
    • Energy
  • Women & Men
    • Clothes
    • Military
    • Tools

Tag Archives: how to be in shape diagram

Perfect Body by Age Group

Posted on April 22, 2021 by chartdiagram
Perfect Body by Age Group

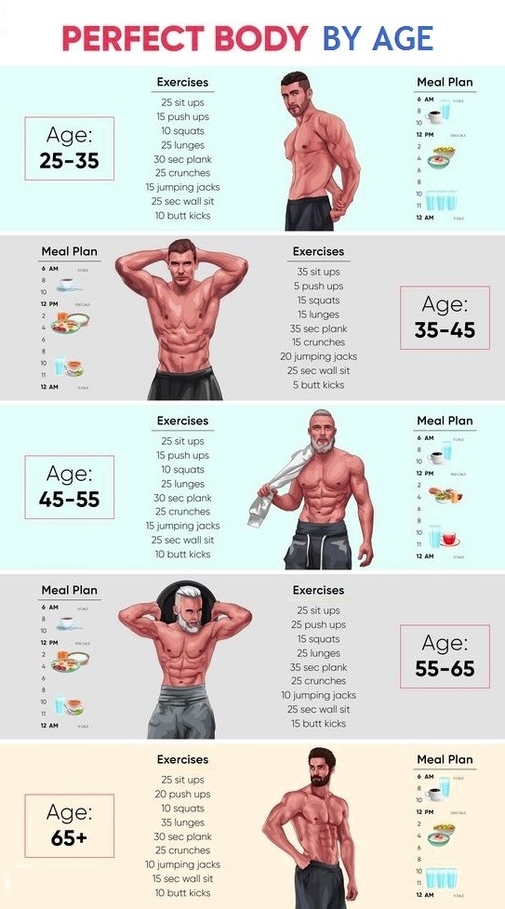
What is a perfect body by age group? What are its characteristics including weight, muscle strength, calory intake and BMI. The below diagram explains how to be in good shape for each of the age groups.

Posted in Health | Tagged how to be in shape diagram, ideal body by age, perfect body by age, perfect body diagram

Primary Sidebar Widget Area

Top Diagrams

  • Scrum diagram the scrum framework captured in simple one picture Scrum Diagram

  • Situational leadership model Situational Leadership Model

  • Bra Sizes – Bra Chart

  • Political Systems Mind Map Political Systems Mind Map

  • Types Of Agriculture 19 Types Of Agriculture Explained

  • Change management framework Change Management Framework

  • Singapore GDP per capita Singapore GDP per capita

  • muscular system diagram Muscular System Diagram

  • Baby Month by Month – Pregnancy Stages

  • Left Right Political Spectrum Left Right Political Spectrum

  • capsule size and weight chart Capsule size and weight chart

  • circulatory system Circulatory System

  • Political Compass Chart Political Compass Chart

  • Maldives GDP per capita Maldives GDP per capita

  • Chicken parts Chicken parts

  • Skin Types Explained Skin Types Explained

  • stress management infographics Stress Management Infographics

  • Cloud Service Models Graphic Cloud Service Models Graphic

  • water pipe fittings with names Water pipe fittings with names

  • How Stress Affects Body How Stress Affects Body

Latest Posts

  • Science Free Body Diagram
  • Singapore GDP per capita
  • Bond Line Structure
  • Demographic Diagram Explained
  • Agile Development in Practice
  • Venn Diagram Design
  • Manufacturing Process Design
  • Simple Business Canvas
  • Customer Satisfaction Survey Results
  • Mastering Business Analysis
  • Business Analysis Best Practice Tools Techniques Methods
  • Data Science Venn Diagram Model
  • People Management Replacing Talent Management
  • What is scrum the agile journey
  • How farming works

Top 20 Tags

  • size (30)
  • food (7)
  • food chart (7)
  • food diagram (7)
  • skin (6)
  • cities (6)
  • world (6)
  • population (6)
  • conversion (6)
  • cancer (5)
  • alcohol diagram (5)
  • sales process diagram (5)
  • car diagram (4)
  • water cycle (4)
  • stress (4)
  • how stress affects body (4)
  • yoga (4)
  • yoga poses (4)
  • yoga workout (4)
  • best yoga (4)

Category

  • Anatomy
  • Business
  • Cancer
  • Clothes
  • Economy
  • Energy
  • Food
  • General
  • Health
  • IT
  • Military
  • Science
  • Sign
  • Sizes
  • Stress
  • Tools
  • Top
  • Women & Men
  • Workout
Copyright © 2026 Charts | Diagrams | Graphs. All Rights Reserved.
Theme: Catch Box by Catch Themes
Scroll Up