Skip to content
cropped cropped chart diagram1 2.png

Charts | Diagrams | Graphs

Charts | Diagrams | Graphs

Menu

Primary menu

  • Top
  • General
    • Upload Diagram
    • Sign
  • Business
  • Economy
  • Sizes
  • Anatomy
  • Health
    • Workout
    • Food
    • Stress
    • Cancer
  • IT
  • Science
    • Energy
  • Women & Men
    • Clothes
    • Military
    • Tools

Marshall Islands GDP per capita

Posted on December 18, 2025 by chartdiagram
Marshall Islands GDP per capita

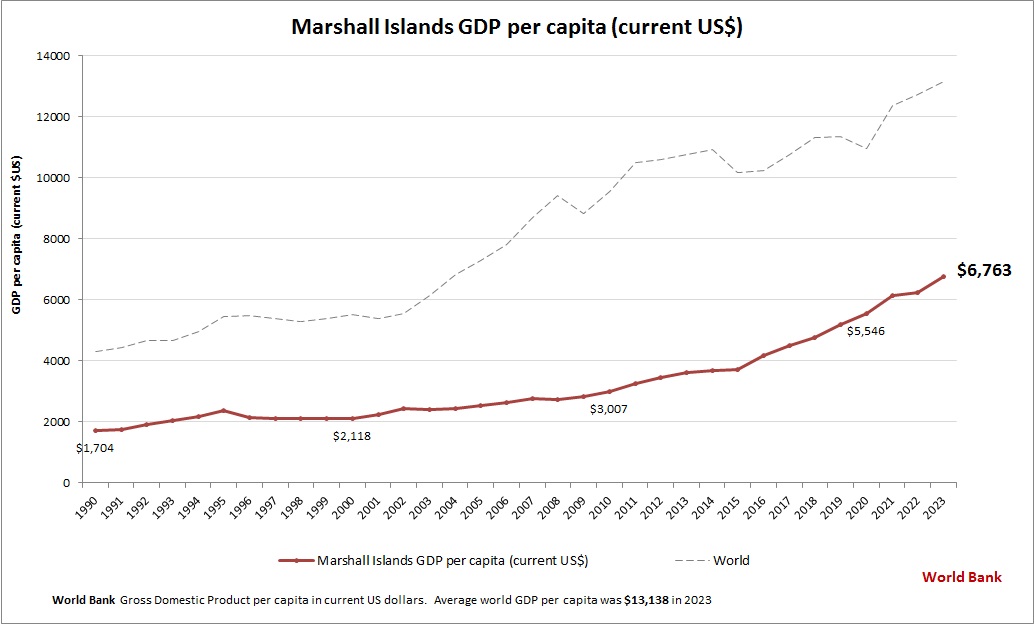
This graph shows Marshall Islands GDP per capita. This is according to World Bank GDP stats by country. Latest GDP per person information for Marshall Islands.

Tags: Marshall Islands data, Marshall Islands economy, Marshall Islands GDP per person, Marshall Islands gross domestic product per capita, Marshall Islands statistics
This entry was posted in Economy and tagged Marshall Islands data, Marshall Islands economy, Marshall Islands GDP per person, Marshall Islands gross domestic product per capita, Marshall Islands statistics by chartdiagram. Bookmark the permalink.

Post navigation

← Previous Previous post: Health Venn Diagram Described
Next → Next post: How Technology Works Blockchain

Primary Sidebar Widget Area

Top Diagrams

  • Uq leadership framework human resources UQ Leadership Framework Human Resources
  • South Sudan GDP per capita South Sudan GDP per capita
  • A theoretical model of change management A Theoretical Model of Change Management
  • Plant Cell Diagram
  • AIMultiple Digital Transformation Framework Aimultiple Digital Transformation Framework
  • Political Parties Venn Diagram Political Parties Venn Diagram
  • Digestive System Diagram
  • Political Compass Chart Political Compass Chart
  • Lora For Smart Cities Lora For Smart Cities
  • Atom Diagram
  • Motorcycles names chart Motorcycles names chart
  • frame size seat height chart Bike Frame Size and Seat Height Chart
  • Leader followers goals Leader Followers Goals
  • engine diagram Engine Diagram
  • Alfred Barr Flowing Tree Of Modern Art Alfred Barr Flowing Tree Of Modern Art
  • Life History Diagram 33 Life History Explanation
  • Newton's Second Law Of Motion Newton’s Second Law Of Motion
  • Essential Geography Skills Essential Geography Skills
  • Artificial intelligence map of cell types Artificial Intelligence Map Of Cell Types
  • Sushi types Sushi types

Latest Posts

  • Cognitive Illustration
  • Aimultiple Digital Transformation Framework
  • Nonprofit Operating Models
  • Business Strategy Mind Map
  • Cloud Service Models Representation
  • Costa Rica GDP per capita
  • Risk Management Process Diagram
  • Evolution of the Digital Workplace
  • Using the Five Forces Model in Industry Analysis
  • Body Diagram Physics Explained
  • More Efficient
  • Business Model Canvas Represented
  • Timeline Of Development
  • Generative Artificial Intelligence
  • Faculty Strategic Planning Process

Top 20 Tags

  • size (30)
  • food (7)
  • food chart (7)
  • food diagram (7)
  • skin (6)
  • cities (6)
  • world (6)
  • population (6)
  • conversion (6)
  • cancer (5)
  • alcohol diagram (5)
  • business strategy diagram (5)
  • sales process diagram (5)
  • car diagram (4)
  • cloud computing diagram (4)
  • water cycle (4)
  • stress (4)
  • how stress affects body (4)
  • yoga (4)
  • yoga poses (4)

Category

  • Anatomy
  • Business
  • Cancer
  • Clothes
  • Economy
  • Energy
  • Food
  • General
  • Health
  • IT
  • Military
  • Science
  • Sign
  • Sizes
  • Stress
  • Tools
  • Top
  • Women & Men
  • Workout
Copyright © 2026 Charts | Diagrams | Graphs. All Rights Reserved.
Theme: Catch Box by Catch Themes
Scroll Up